Chart AUD/USD Update: Sharp pullback from fresh year high
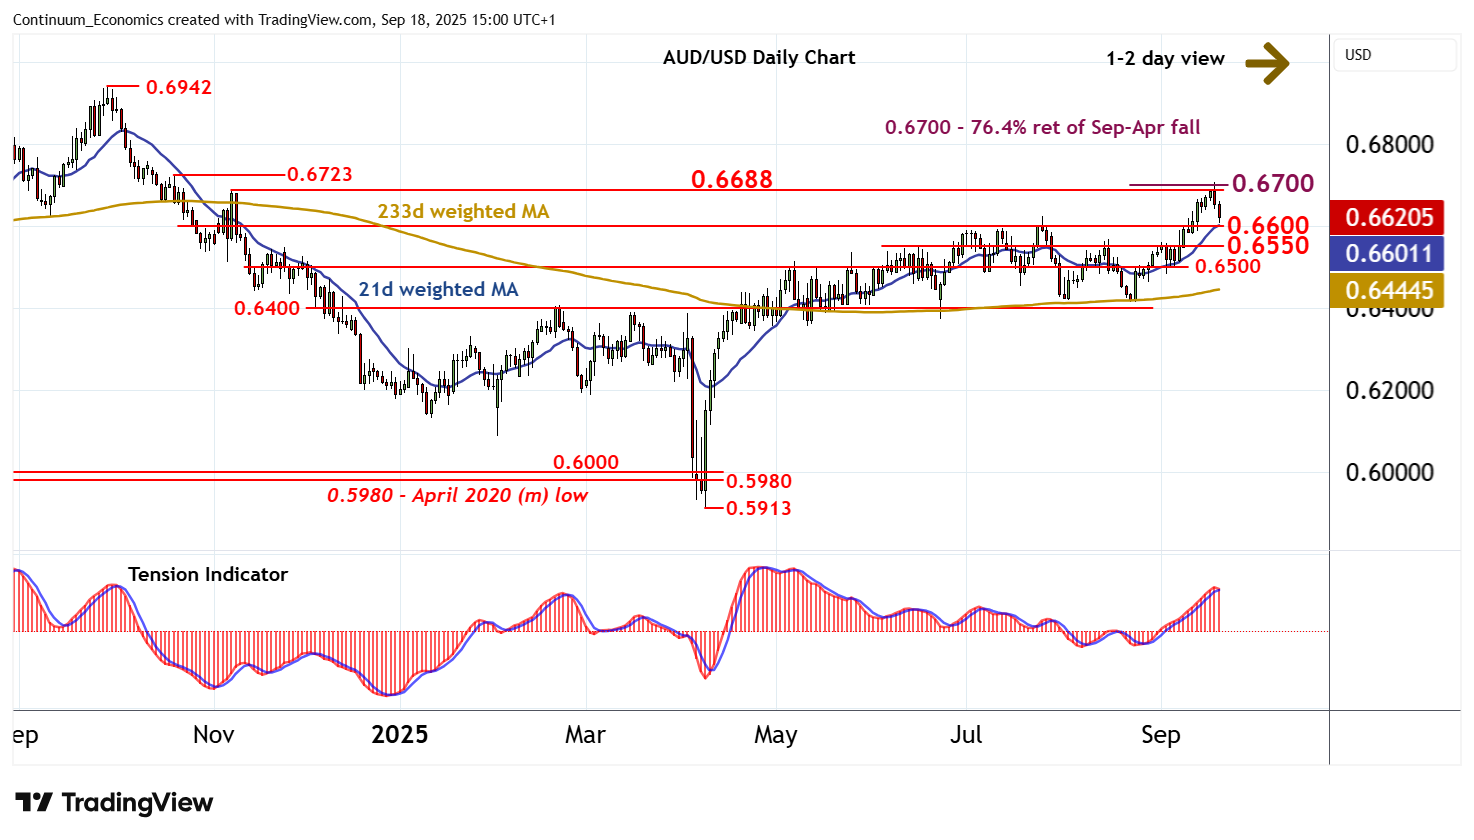
The spike above critical resistance at the 0.6688 monthly high of 7 November and the 0.6700 Fibonacci retracement has been pushed back from 0.6707
| Levels | Imp | Comment | Levels | Imp | Comment | |||
|---|---|---|---|---|---|---|---|---|
| R4 | 0.6800 | * | break level | S1 | 0.6600 | ** | congestion | |
| R3 | 0.6723 | 21 Oct (w) high | S2 | 0.6550 | * | congestion | ||
| R2 | 0.6700 | ** | 76.4% ret of Sep-Apr fall | S3 | 0.6500 | * | congestion | |
| R1 | 0.6688 | ** | 7 Nov (m) high | S4 | 0.6400 | ** | congestion |
Asterisk denotes strength of level
14:50 BST - The spike above critical resistance at the 0.6688 monthly high of 7 November and the 0.6700 Fibonacci retracement has been pushed back from 0.6707, as intraday studies turn down, with steady selling interest putting focus on congestion support at 0.6600. Overbought daily stochastics are unwinding and the positive daily Tension Indicator is also turning down, highlighting a deterioration in sentiment and room for deeper losses in the coming sessions. A break below 0.6600 will add weight to sentiment and open up 0.6550. But mixed/positive weekly charts should limit any further losses in consolidation above congestion around 0.6500. Meanwhile, a close above 0.6700 is needed to turn sentiment positive and confirm continuation of April gains, beyond the 0.6723 weekly high of 21 October towards 0.6800.