Published: 2026-04-01T14:02:42.000Z
Chart AUD/USD Update: Gains to remain limited
1
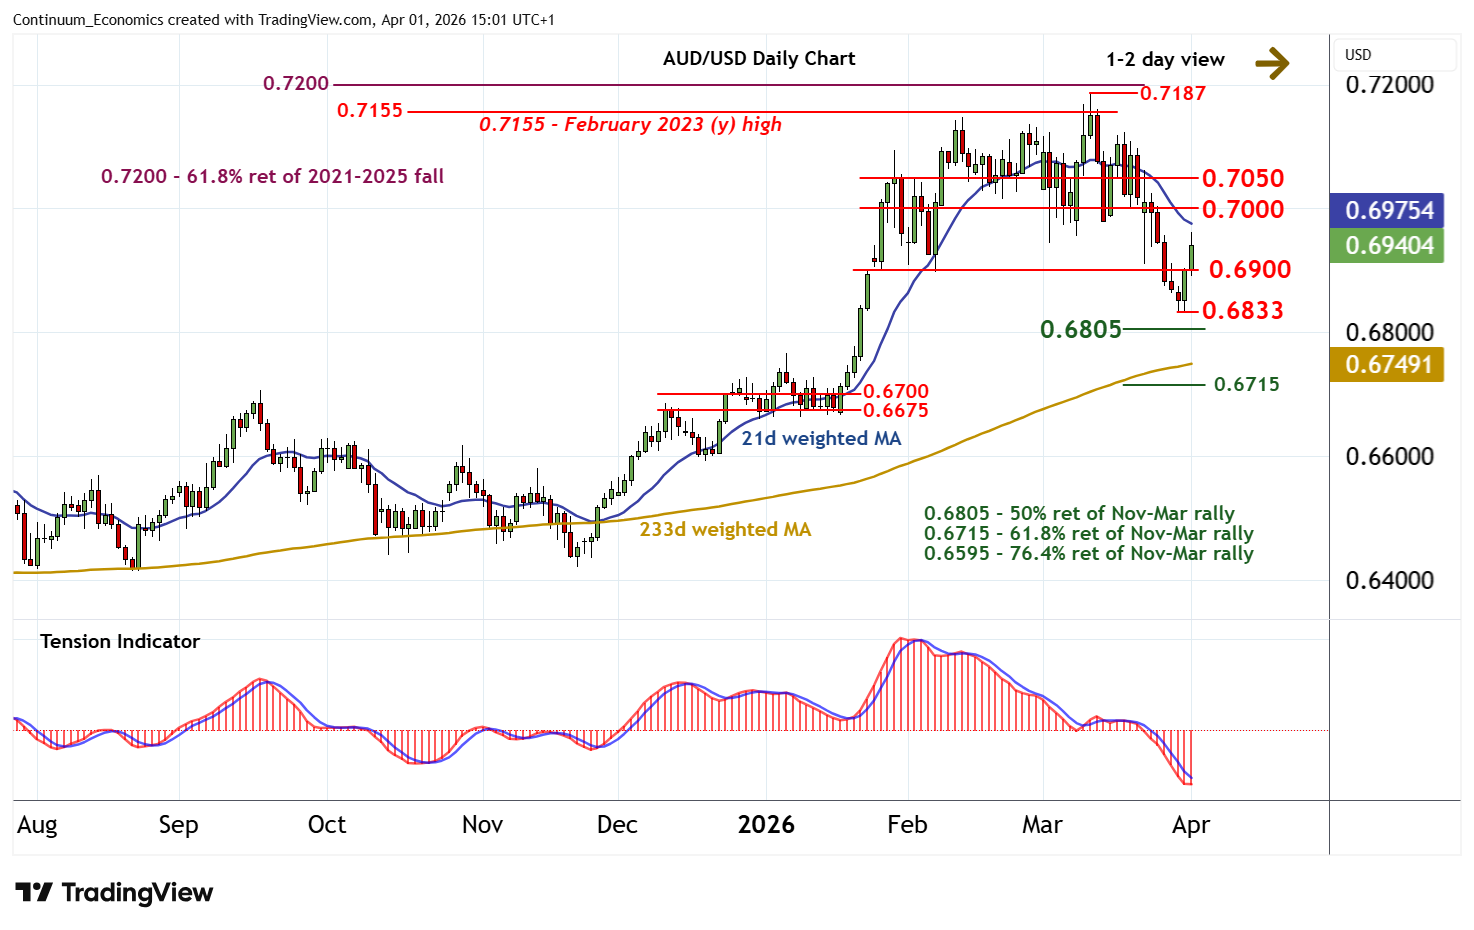
The anticipated break above 0.6900 has reached 0.6960
| Levels | Imp | Comment | Levels | Imp | Comment | |||
|---|---|---|---|---|---|---|---|---|
| R4 | 0.7187 | ** | 11 Mar YTD high | S1 | 0.6900 | * | break level | |
| R3 | 0.7100 | break level | S2 | 0.6833 | ** | 30 Mar (m) low | ||
| R2 | 0.7050 | * | congestion | S3 | 0.6805 | ** | 50% ret of Nov-Mar rally | |
| R1 | 0.7000 | * | congestion | S4 | 0.6715 | ** | 61.8% ret of Nov-Mar rally |
Asterisk denotes strength of level
15:00 BST - The anticipated break above 0.6900 has reached 0.6960, where short-term consolidation is developing. Intraday studies are rising and oversold daily stochastics are unwinding, highlighting room for continuation towards congestion resistance at 0.7000. But the negative daily Tension Indicator and bearish weekly charts should limit any further gains in renewed selling interest beneath 0.7050. Meanwhile, support is raised to 0.6900. But a close beneath the 0.6833 monthly low of 30 March is needed to turn sentiment negative and extend March losses, initially to the 0.6805 Fibonacci retracement.