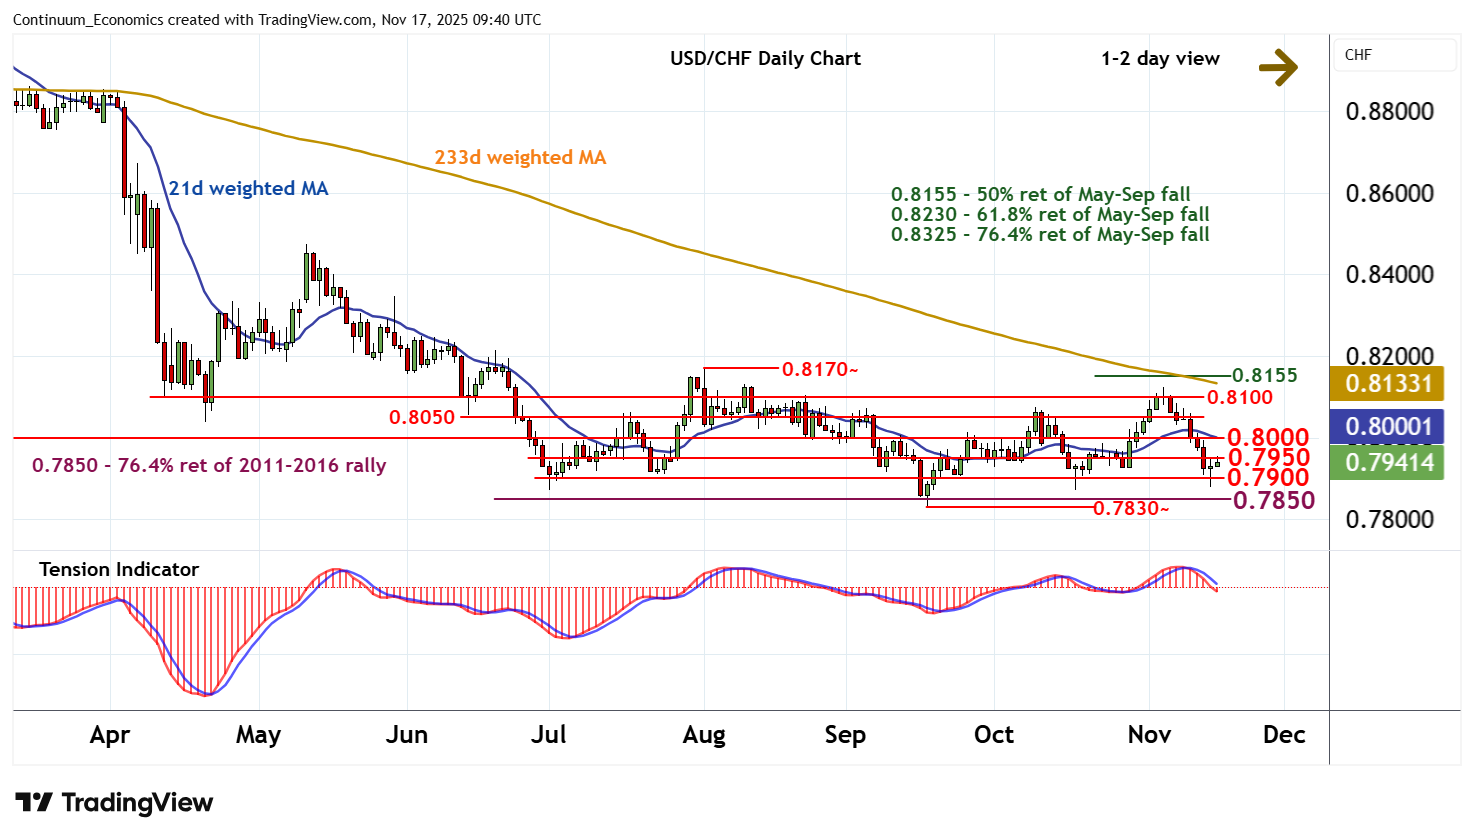
Chart USD/CHF Update: Consolidating recent losses
The test below 0.7900 has bounced sharply from 0.7878, with prices reaching congestion resistance at 0.7950
| Level | Comment | Level | Comment | |||||
|---|---|---|---|---|---|---|---|---|
| R4 | 0.8100 | ** | break level | S1 | 0.7900 | * | congestion | |
| R3 | 0.8050 | break level | S2 | 0.7878 | * | 14 Nov (w) low | ||
| R2 | 0.8000 | ** | congestion | S3 | 0.7850 | ** | 76.4% ret of 2011-2016 rally | |
| R1 | 0.7950 | * | congestion | S4 | 0.7830 | ** | 17 Sep YTD low |
Asterisk denotes strength of level
09:20 GMT - The test below 0.7900 has bounced sharply from 0.7878, with prices reaching congestion resistance at 0.7950. Intraday studies are rising, suggesting room for a test above here. But negative daily readings and deteriorating weekly charts should limit scope in renewed selling interest beneath further congestion around 0.8000. In the coming sessions, cautious trade is looked for, with support at congestion around 0.7900. Critical support, however, is at the 0.7830 current year low of 17 September and the 0.7850 Fibonacci retracement. A close beneath here would turn sentiment negative and extend December 2016 losses initially towards 0.7800.