Published: 2026-04-01T02:03:45.000Z
Chart GBP/USD Update: Consolidating at 1.3160, fresh year low
2
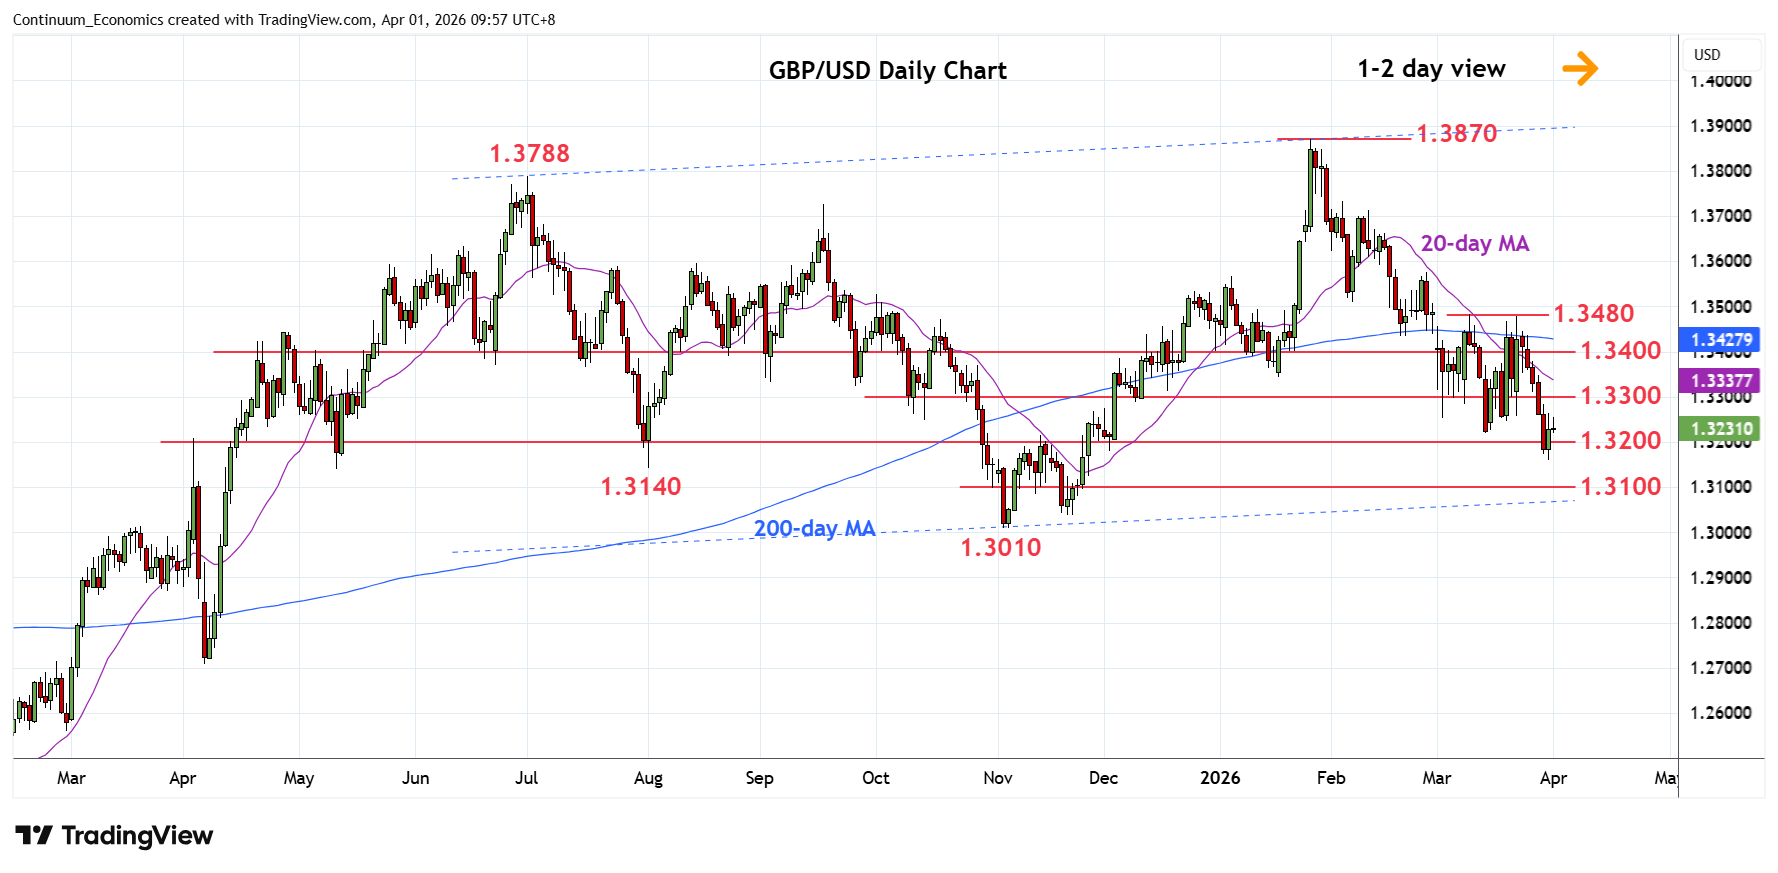
Turned up from the 1.3160 fresh year low as prices consolidate losses from the 1.3480 high of last week
| Level | Comment | Level | Comment | |||||
|---|---|---|---|---|---|---|---|---|
| R4 | 1.3400 | ** | congestion | S1 | 1.3200 | * | congestion | |
| R3 | 1.3350 | * | congestion | S2 | 1.3160 | ** | 31 Mar YTD low | |
| R2 | 1.3300 | * | congestion | S3 | 1.3140 | * | May, Aug lows | |
| R1 | 1.3250 | * | congestion | S4 | 1.3100 | * | congestion |
Asterisk denotes strength of level
02:00 GMT - Turned up from the 1.3160 fresh year low as prices consolidate losses from the 1.3480 high of last week. Intraday studies are unwinding oversold readings but pressure remains on the downside and further losses cannot be ruled out. However, daily studies are stretched and caution corrective bounce with resistance starting at the 1.3250/1.3300 area. Would take break here to ease the downside pressure and see room for stronger bounce to the 1.3400 congestion. Meanwhile, support at the 1.3200/1.3160 now underpin. Break here will see room to the 1.3140 support and 1.3100 congestion.