Published: 2025-10-28T16:38:46.000Z
Chart USD/CAD Update: Lower in CAD-driven trade
2
Cautious trade around 1.4000 has given way to a sharp CAD-driven fall
| Levels | Imp | Comment | Levels | Imp | Comment | |||
|---|---|---|---|---|---|---|---|---|
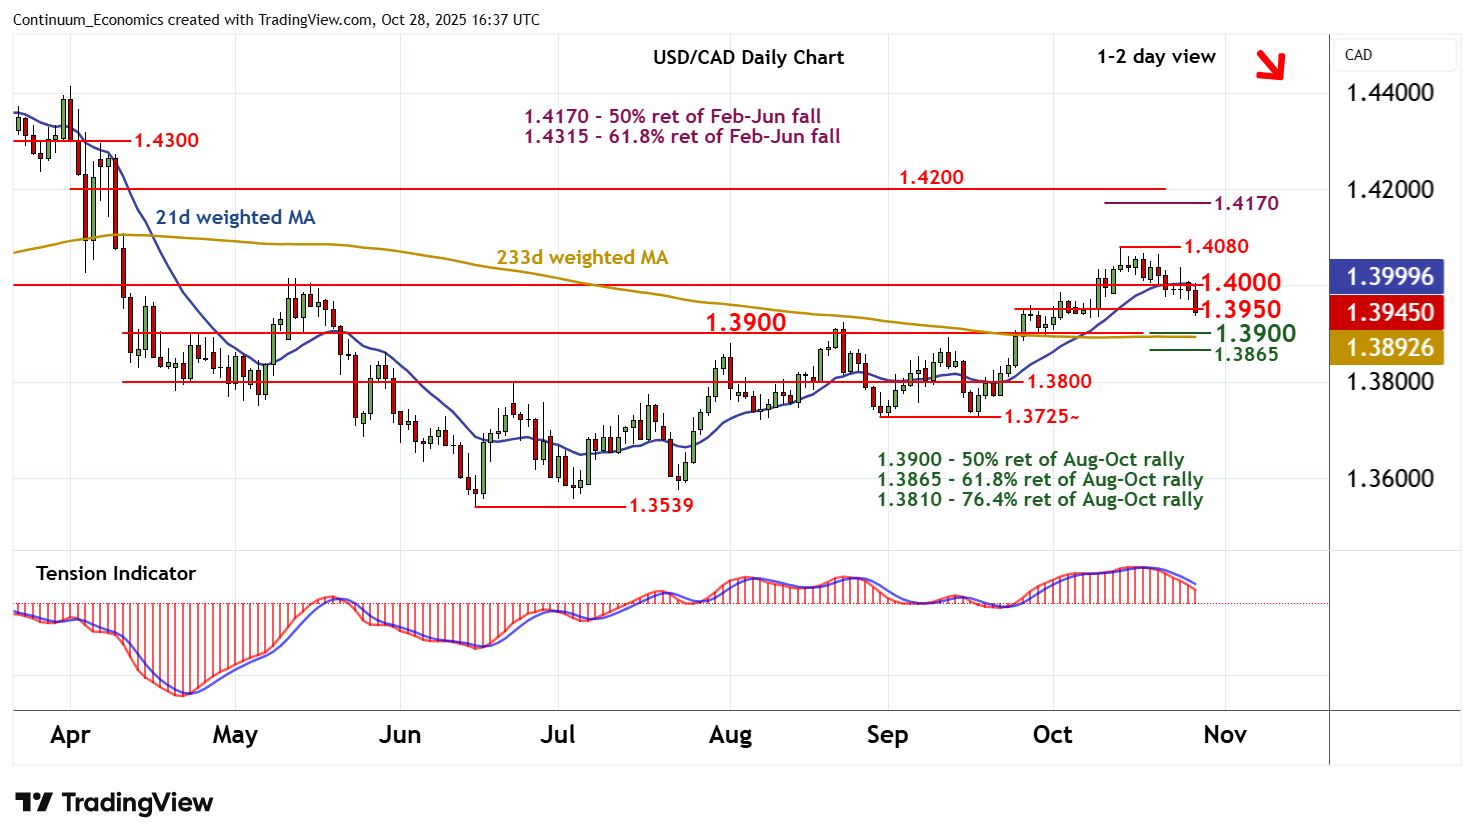
| R4 | 1.4170 | ** | 50% ret of Feb-Jun fall | S1 | 1.3900 | ** | break level, 50% ret | |
| R3 | 1.4080 | ** | 14 Oct (w) high | S2 | 1.3865 | ** | 61.8% ret of Aug-Oct rally | |
| R2 | 1.4000 | * | break level | S3 | 1.3800/10 | ** | cong, 76.4% ret | |
| R1 | 1.3950 | * | pivot | S4 | 1.3725~ | ** | 29 Aug - 17 Sep lows |
Asterisk denotes strength of level
16:20 GMT - Cautious trade around 1.4000 has given way to a sharp CAD-driven fall, with prices currently trading below 1.3950. Daily readings are negative and broader weekly charts are coming under fresh pressure, highlighting room for further losses in the coming sessions. Support is at 1.3900. Flat oversold daily stochastics could limit any initial tests in consolidation, before fresh selling pressure prompts a break and extends losses towards the 1.3865 Fibonacci retracement. Meanwhile, a close back above resistance at 1.3950 will help to stabilise price action and prompt consolidation beneath 1.4000.