Chart USD/ZAR Update: Balanced above fresh 2025 year low
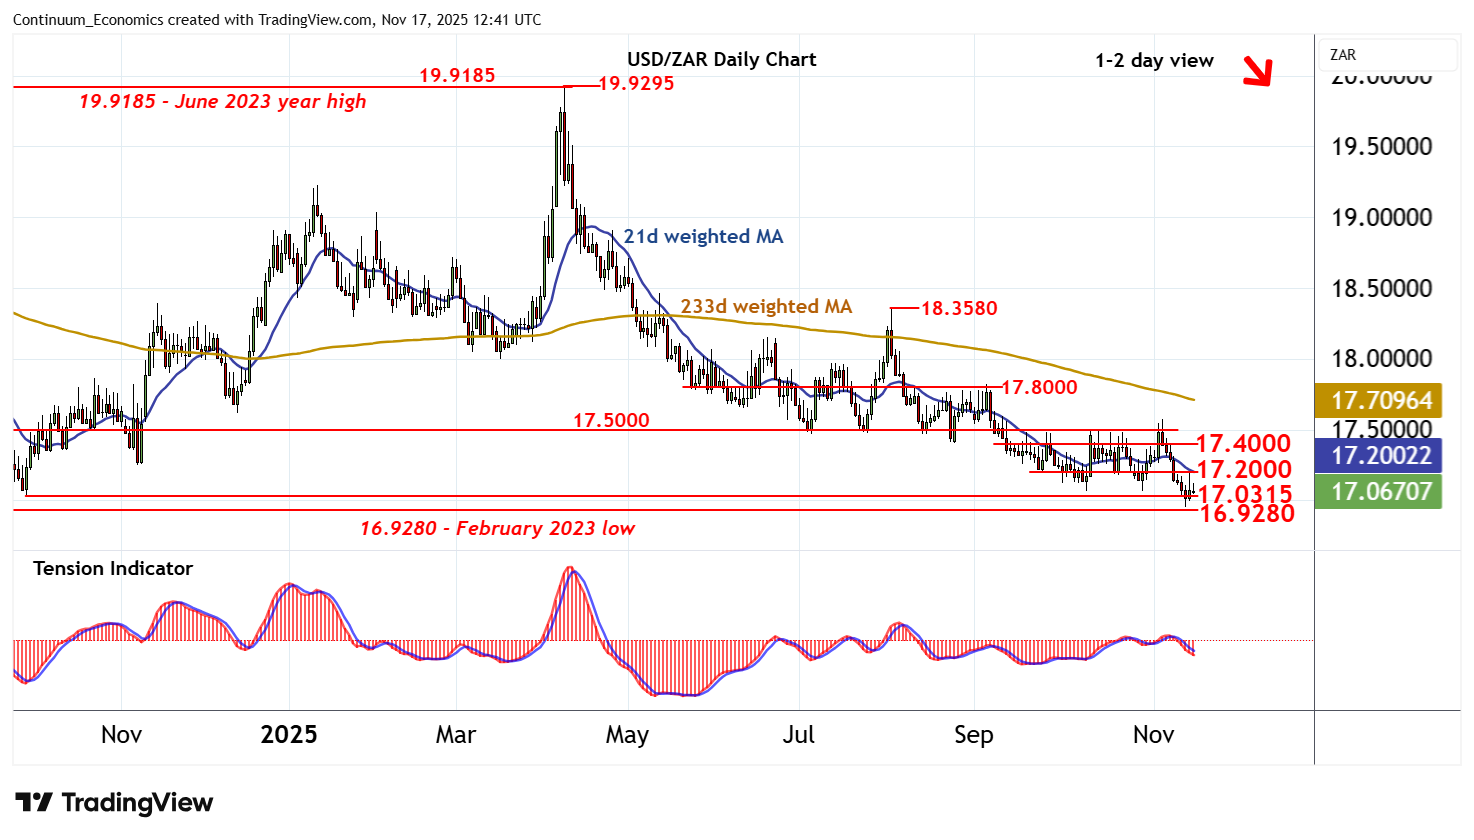
The anticipated break below the 17.0315 year low of 30 September 2024 has bounced from the 16.9495 current year low of 13 November
| Level | Comment | Level | Comment | |||||
|---|---|---|---|---|---|---|---|---|
| R4 | 17.5625 | ** | 38.2% ret of Aug-Oct fall | S1 | 17.0315 | ** | 30 Sep 2024 (y) low | |
| R3 | 17.5000 | ** | congestion | S2 | 17.0000 | ** | congestion | |
| R2 | 17.4000 | * | congestion | S3 | 16.9495 | ** | 13 Nov YTD low | |
| R1 | 17.2000 | * | congestion | S4 | 16.9280 | February 2023 low |
Asterisk denotes strength of level
12:25 GMT - The anticipated break below the 17.0315 year low of 30 September 2024 has bounced from the 16.9495 current year low of 13 November, as intraday studies turn higher, with prices currently balanced in choppy trade above 17.0000. Oversold daily stochastics are unwinding, suggesting room for a minor test higher. But the falling daily Tension Indicator and deteriorating weekly charts are expected to limit any fresh gains in renewed selling interest beneath congestion resistance at 17.2000. Following cautious trade, lower levels are looked for. A later close below 17.0000 will add weight to sentiment and extend May 2023 losses below the 16.9280 low of February 2023 towards the 16.6900 year low of January 2023.