Published: 2026-01-27T08:49:12.000Z
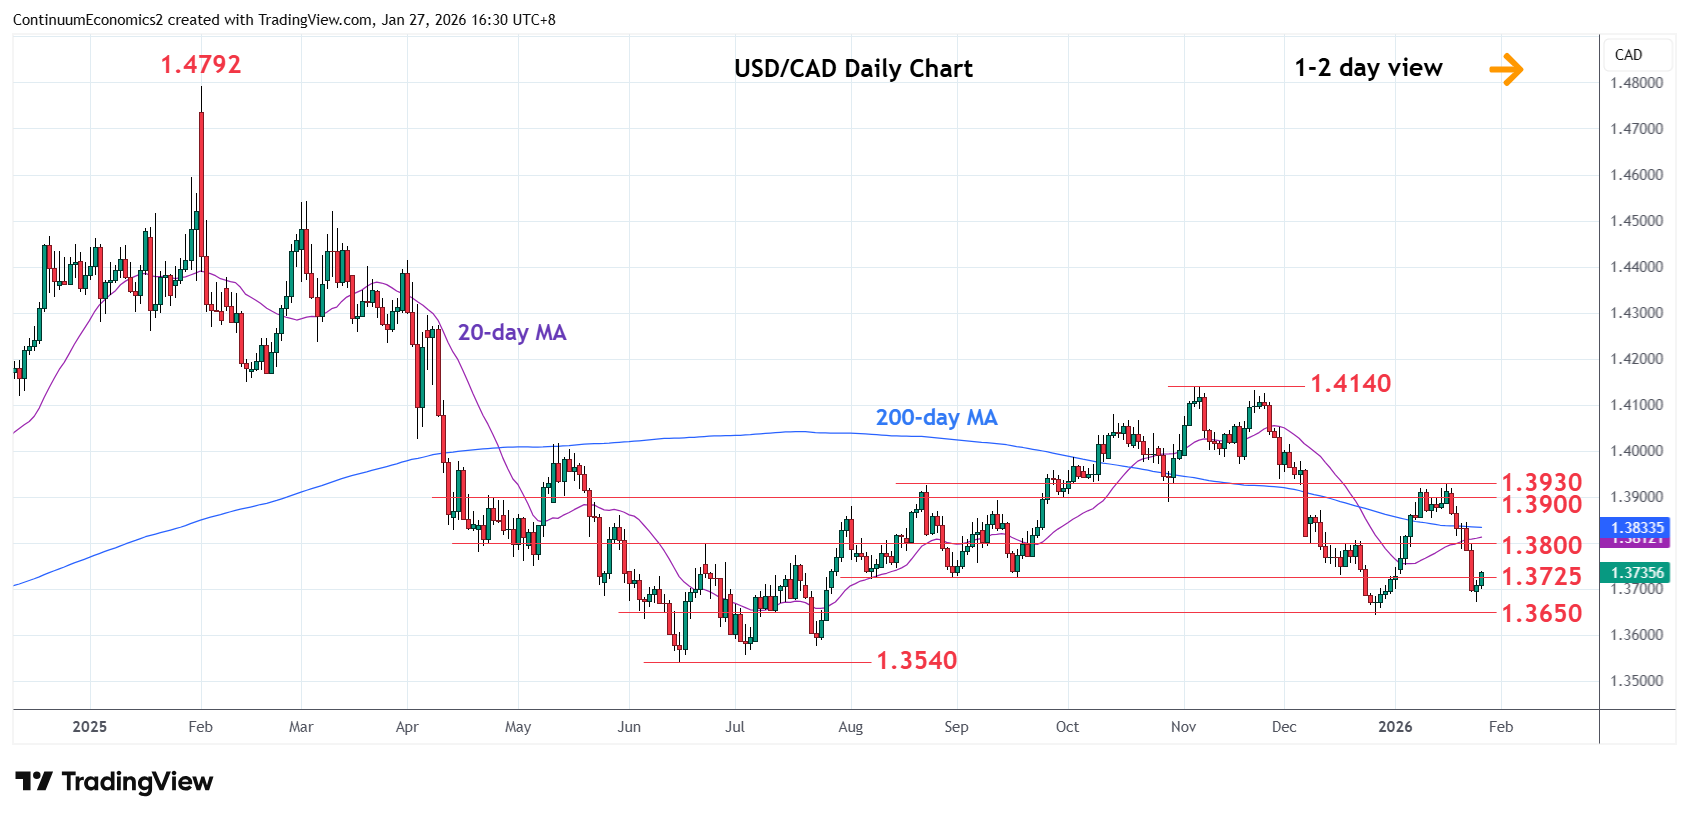
Chart USD/CAD Update: Extend corrective bounce 1.3670 low
3
Bounce from the 1.3670 low to regain the 1.3700 level see prices unwinding oversold intraday studies
| Levels | Imp | Comment | Levels | Imp | Comment | |||
|---|---|---|---|---|---|---|---|---|
| R4 | 1.3970 | * | 18 Nov low | S1 | 1.3670 | 26 Jan low | ||
| R3 | 1.3900/30 | ** | congestion, 16 Jan high | S2 | 1.3650/40 | ** | congestion, 26 Dec low | |
| R2 | 1.3850 | * | congestion | S3 | 1.3600 | * | congestion | |
| R1 | 1.3750/00 | * | congestion | S4 | 1.3575/55 | * | Jul lows |
Asterisk denotes strength of level
08:35 GMT - Bounce from the 1.3670 low to regain the 1.3700 level see prices unwinding oversold intraday studies. Negative daily studies are stretched as well and suggest scope for bounce to correct losses from the 1.3930 high of last week. Above the 1.3700/25 area see room for stronger bounce to resistance at the 1.3750/1.3800 congestion area which is expected to cap. Meanwhile, support is raised to the 1.3700 level. Would take break here to expose the 1.3670/40 lows to retest. Below these will return focus to the 1.3575/40, July and June 2025 year lows.