Chart USD/ZAR Update: Extending gains

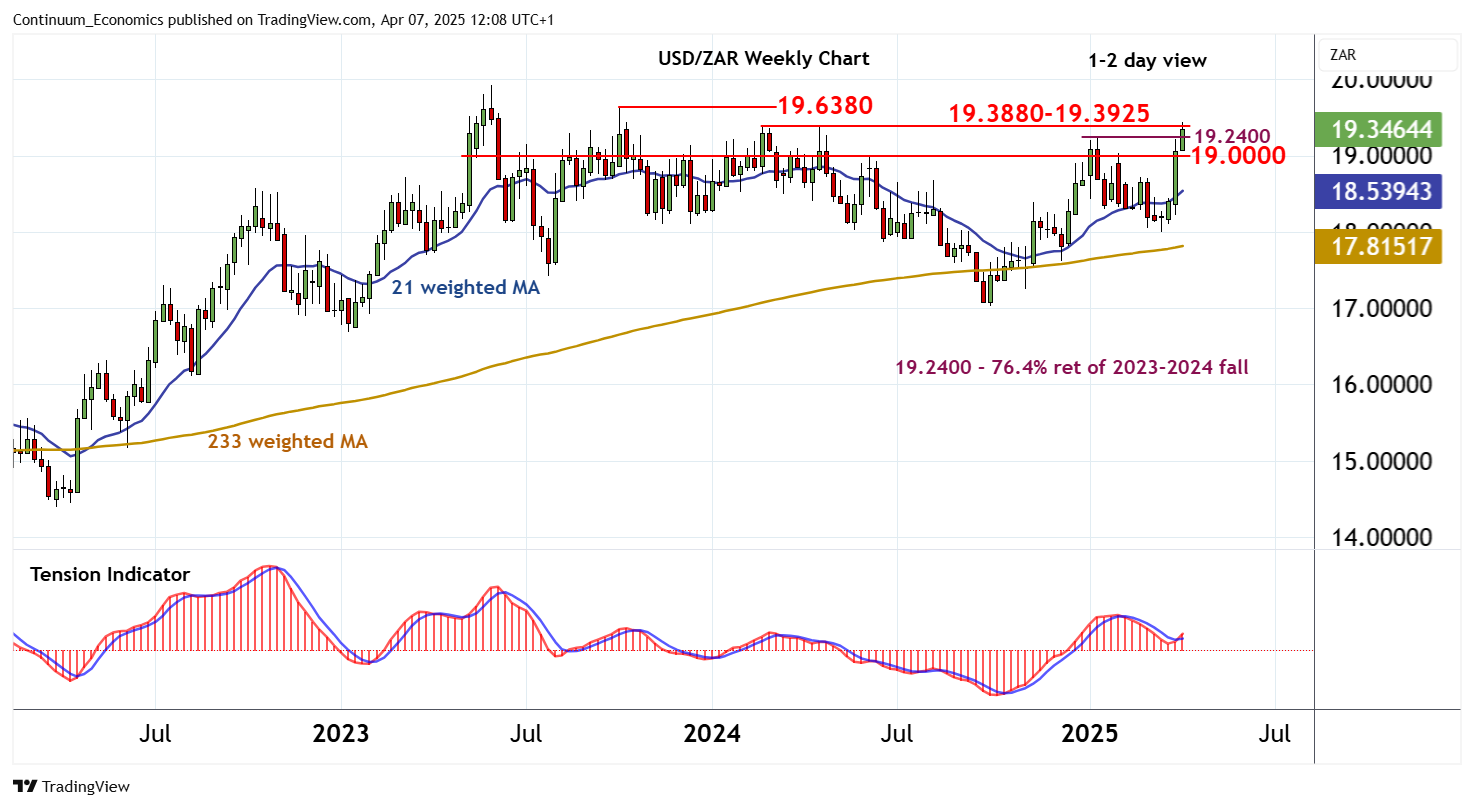
Anticipated gains have tested above the 19.2400 Fibonacci retracement
| Level | Comment | Level | Comment | |||||
|---|---|---|---|---|---|---|---|---|
| R4 | 19.6380 | ** | October 2023 (m) high | S1 | 19.0000 | ** | congestion | |
| R3 | 19.3925 | ** | February 2024 (y) high | S2 | 18.7250 | * | congestion | |
| R2 | 19.3880 | ** | April 2024 high | S3 | 18.5000 | ** | break level | |
| R1 | 19.2400 | ** | 76.4% ret of 2023-2024 fall | S4 | 18.3000 | ** | break level |
Asterisk denotes strength of level
11:50 BST - Anticipated gains have tested above the 19.2400 Fibonacci retracement, with prices currently consolidating the test above further resistance at the 19.2400 - 19.3880 - 19.3925 year highs of February-April 2024. Overbought daily stochastics are flat, suggesting potential for further choppy trade within this broad 19.2400 - 19.3925 range. But the daily Tension Indicator is positive and broader weekly charts continue to improve, suggesting room for a later break. A close above 19.3925 will turn sentiment positive and extend September 2024 gains towards stronger resistance at the 19.6380 monthly high of October 2023. Meanwhile, support is raised to congestion around 19.0000. A close beneath here, if seen, would add weight to sentiment and delay any further gains, as profit-taking then opens up congestion around 18.7250.