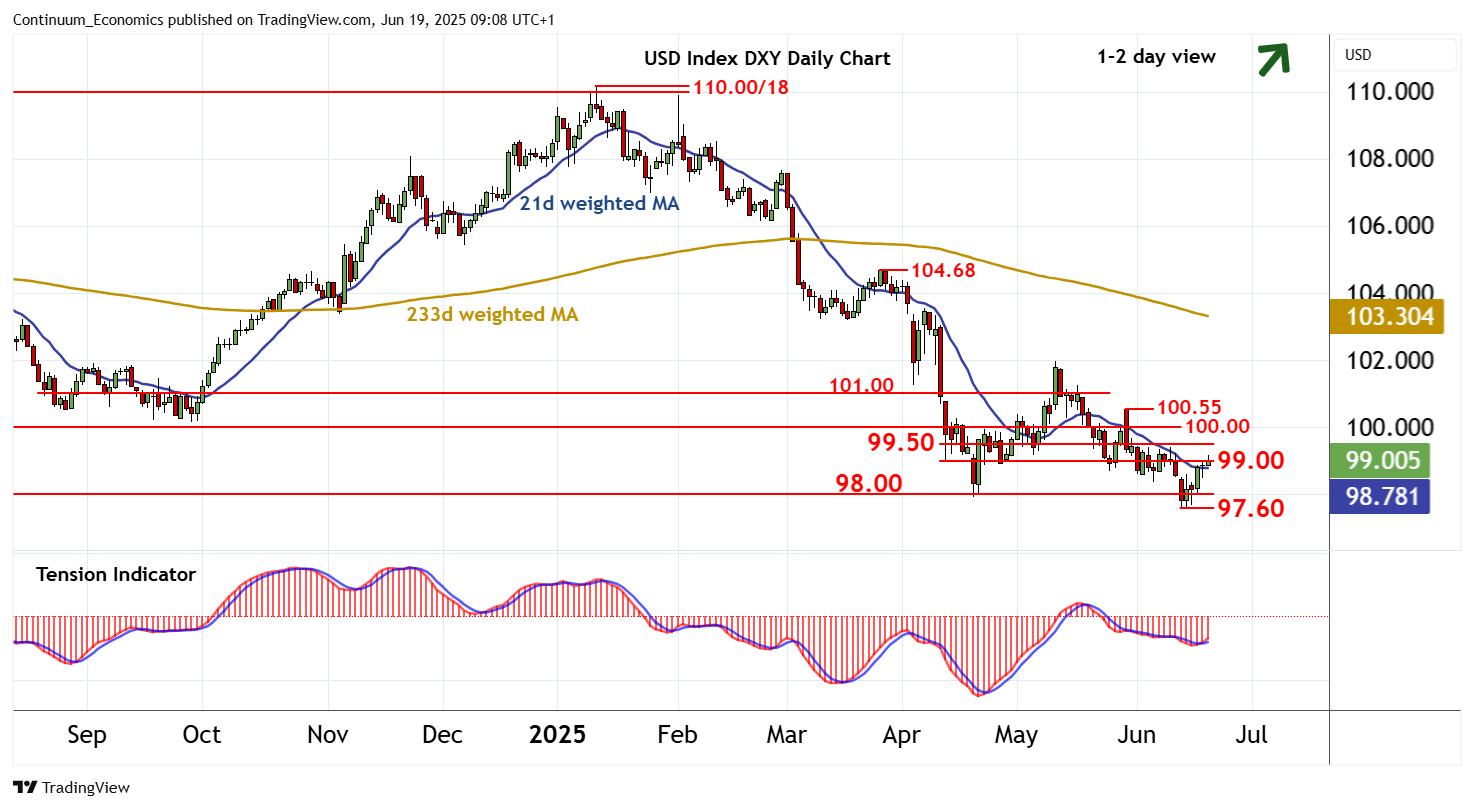
Chart USD Index DXY Update: Daily studies rising

Little change, as flat overbought intraday studies prompt cautious trade around resistance at 99.00
| Levels | Imp | Comment | Levels | Imp | Comment | |||
|---|---|---|---|---|---|---|---|---|
| R4 | 100.55 | * | 29 May (w) high | S1 | 98.00 | * | congestion | |
| R3 | 100.00 | ** | congestion | S2 | 97.70 | * | early-Mar 22 (w) low | |
| R2 | 99.50 | congestion | S3 | 97.60 | * | 12 Jun YTD low | ||
| R1 | 99.00 | break level | S4 | 96.50 | * | congestion |
Asterisk denotes strength of level
09:00 BST - Little change, as flat overbought intraday studies prompt cautious trade around resistance at 99.00. Daily readings continue to track higher and broader weekly charts are improving, suggesting room for a test above here towards congestion around 99.50. But negative longer-term readings are expected to limit any further gains in selling interest towards congestion around 100.00. Following corrective trade, fresh losses are looked for. Support remains at congestion around 98.00. But a close below 97.60/70 is needed to turn sentiment negative and confirm continuation of September 2022 losses, initially towards 96.50.