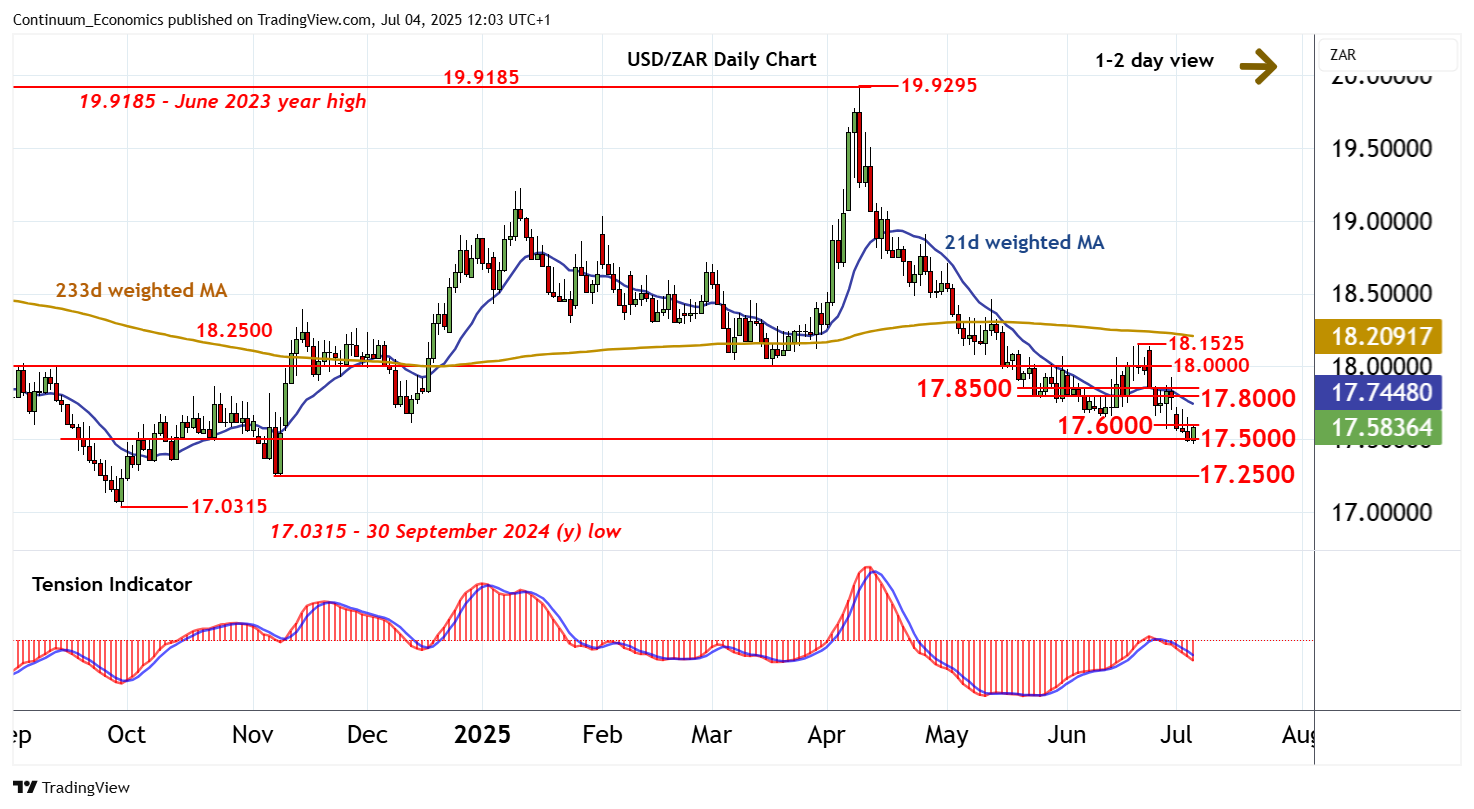
Chart USD/ZAR Update: Limited tests higher

Consolidation around congestion support at 17.5000 has given way to a bounce
| Level | Comment | Level | Comment | |||||
|---|---|---|---|---|---|---|---|---|
| R4 | 18.0000 | ** | congestion | S1 | 17.5000 | * | congestion | |
| R3 | 17.8500 | break level | S2 | 17.4680~ | current year low | |||
| R2 | 17.8000 | * | congestion | S3 | 17.2500 | * | 7 Nov (m) low | |
| R1 | 17.6000 | * | congestion | S4 | 17.0315 | ** | 30 Sep 2024 (y) low |
Asterisk denotes strength of level
11:50 BST - Consolidation around congestion support at 17.5000 has given way to a bounce, as intraday studies turn higher, with prices currently pressuring congestion resistance at 17.6000. Oversold daily stochastics are also turning up, suggesting room for a test above here. But the bearish daily Tension Indicator and negative weekly charts should prompt renewed selling interest beneath further congestion around 17.8000. Following corrective trade, fresh losses are looked for. A later close below 17.5000 will add weight to sentiment and extend April losses towards the 17.2500 monthly low of 7 November. Already oversold daily stochastics could prompt fresh consolidation/short-covering towards here.