Published: 2026-04-02T00:38:03.000Z
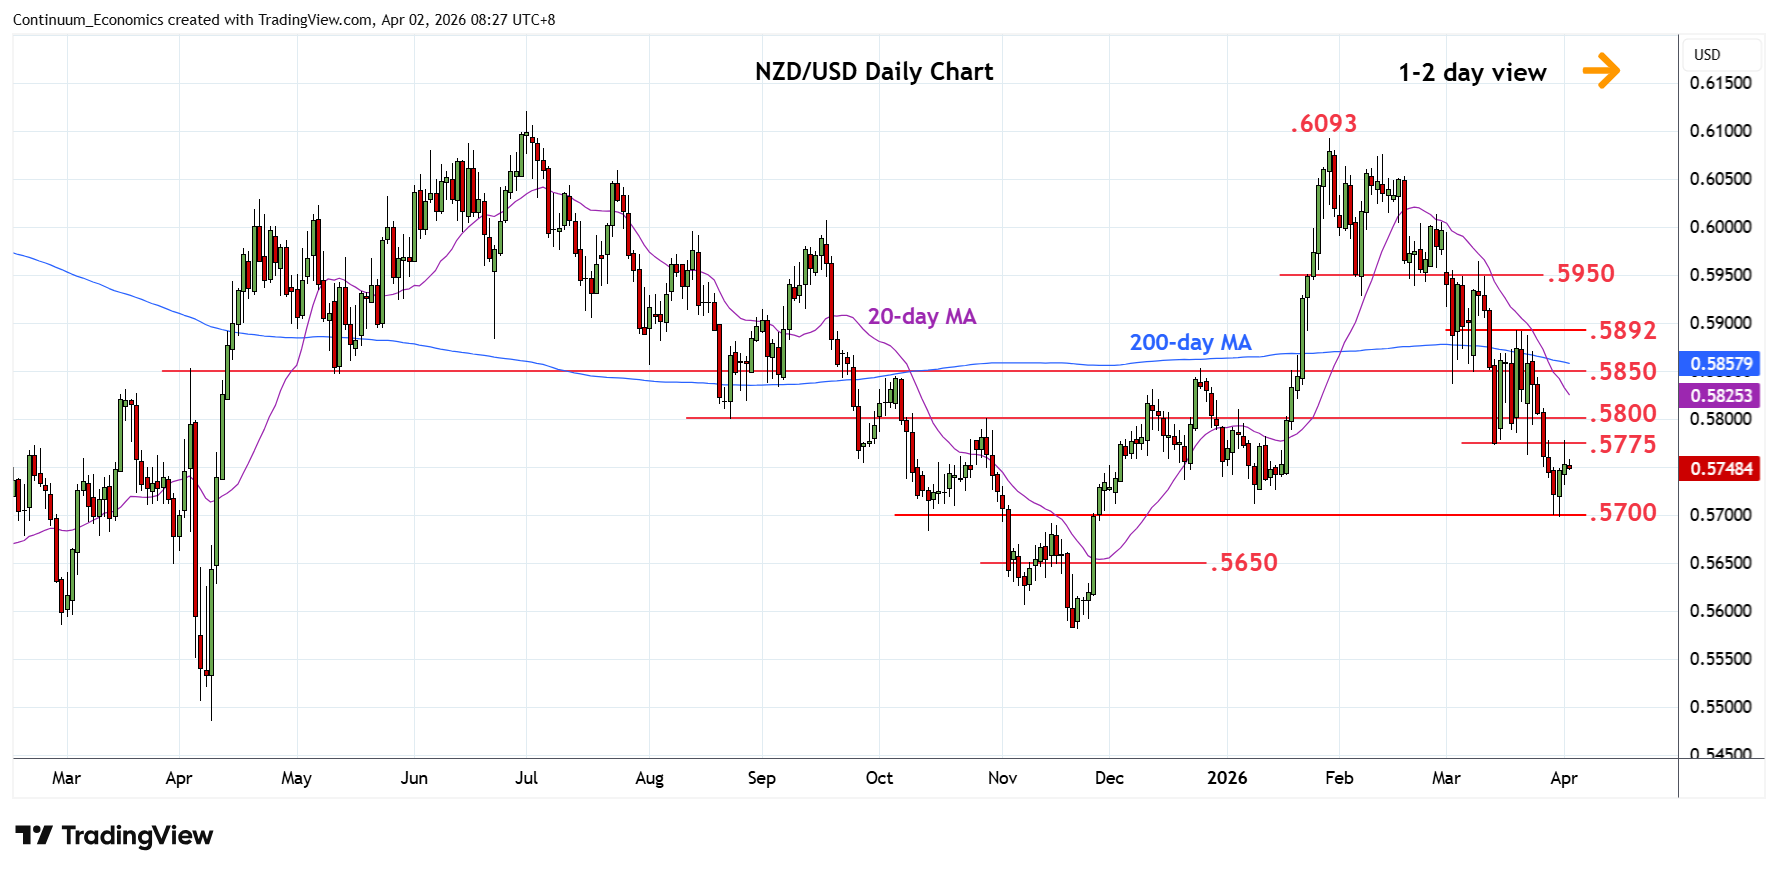
Chart NZD/USD Update: Extend consolidation above .5700
-
Settled back from test of resistance at .5775 as prices extend consolidation above the .5700 low
| Levels | Imp | Comment | Levels | Imp | Comment | |||
|---|---|---|---|---|---|---|---|---|
| R4 | .5892 | ** | 19 Mar high | S1 | .5700 | * | 30 Mar YTD low, 76.4% | |
| R3 | .5850 | ** | congestion | S2 | .5650 | * | congestion | |
| R2 | .5800 | * | congestion | S3 | .5606 | * | 7 Nov low | |
| R1 | .5775 | * | 13 Mar low | S4 | .5578 | ** | 21 Nov low |
Asterisk denotes strength of level
00:30 GMT - Settled back from test of resistance at .5775 as prices extend consolidation above the .5700 low. Bearish structure from the January high keeps pressure on the downside and only break above resistance at the .5775/.5800 congestion will ease the downside pressure and see room to the stronger gains to the .5850/92 area. Meanwhile, support at the .5700 low now underpin. Would take break here to opens up room for extension to the .5650 congestion. Below here will return focus to the .5600/.5578 congestion and November low.