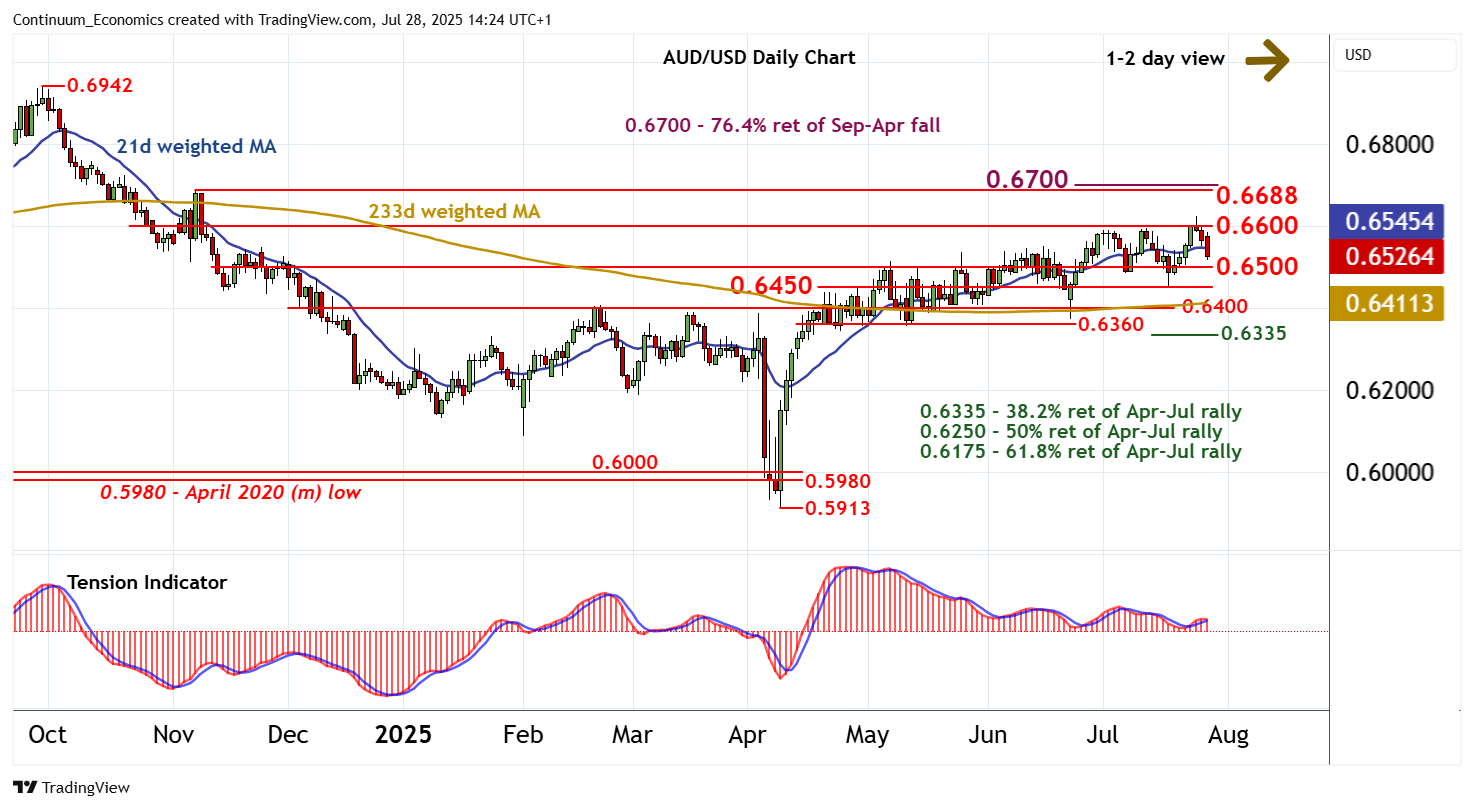
Chart AUD/USD Update: Leaning lower in range

The pullback from the 0.6625 current year high of 24 July is extending
| Levels | Imp | Comment | Levels | Imp | Comment | |||
|---|---|---|---|---|---|---|---|---|
| R4 | 0.6700 | ** | 76.4% ret of Sep-Apr fall | S1 | 0.6500 | * | congestion | |
| R3 | 0.6688 | ** | 7 Nov (m) high | S2 | 0.6450 | congestion | ||
| R2 | 0.6625 | 24 Jul YTD high | S3 | 0.6400 | * | break level | ||
| R1 | 0.6600 | ** | congestion | S4 | 0.6360 | ** | break level |
Asterisk denotes strength of level
14:20 BST - The pullback from the 0.6625 current year high of 24 July is extending, as intraday studies turn down, with focus on congestion support at 0.6500. Oversold intraday studies could prompt short-term reactions around here, before deteriorating daily and weekly charts prompt a break. A close below 0.6500 will open up further congestion around 0.6450. Beneath here is 0.6400. Meanwhile, resistance remains at congestion around 0.6600. A close above here is needed to turn sentiment positive and extend April gains to fresh 2025 year highs towards strong resistance at the 0.6688 monthly high of 7 November and the 0.6700 Fibonacci retracement.