Published: 2026-04-24T01:24:34.000Z
Chart EUR/USD Update: Deeper retrace of March/April gains
1
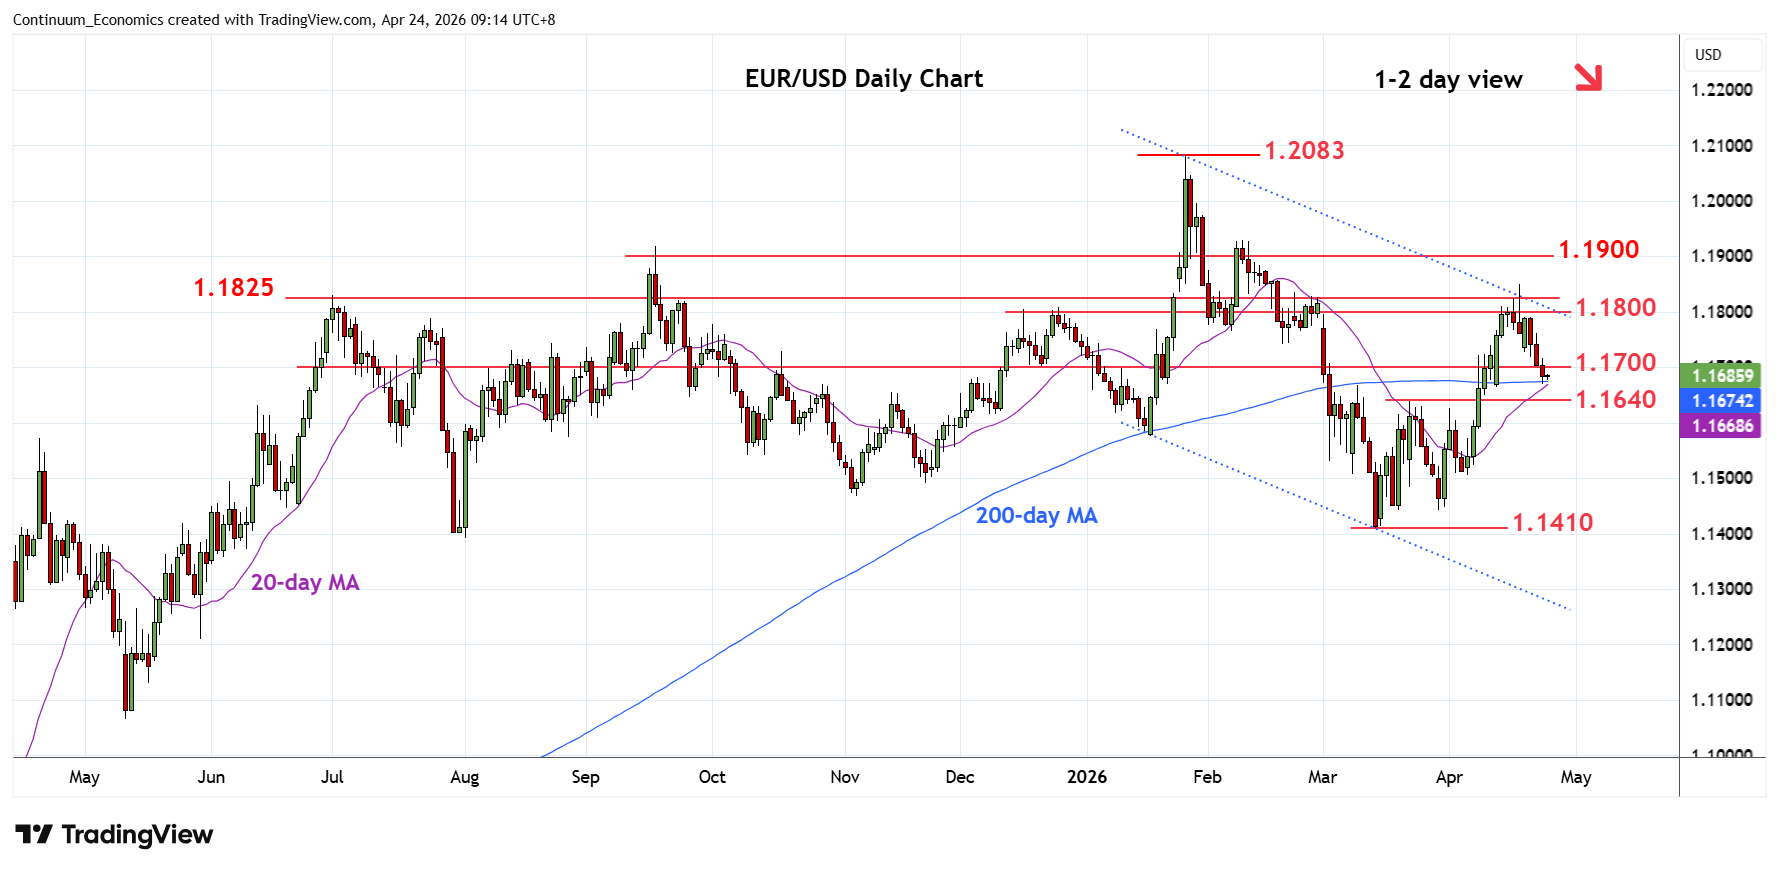
Break of the 1.1700 has seen pullback to retest the 200-day MA at 1.1670
| Levels | Imp | Comment | Levels | Imp | Comment | |||
|---|---|---|---|---|---|---|---|---|
| R4 | 1.1850 | * | 17 Apr high, congestion | S1 | 1.1670 | * | 200-day MA | |
| 14 | 1.1825 | * | 61.8% Jan/Mar fall | S2 | 1.1640 | ** | 23 Mar high | |
| R2 | 1.1800 | ** | congestion | S3 | 1.1600 | * | congestion | |
| R1 | 1.1750 | congestion | S4 | 1.1576 | * | Jan low |
Asterisk denotes strength of level
01:20 GMT - Break of the 1.1700 has seen pullback to retest the 200-day MA at 1.1670. Below this will see room for deeper pullback to the strong support at 1.1640/00, 23 March high and congestion area which is expected to underpin and give way to renewed buying interest later. Meanwhile, resistance is lowered to the 1.1750 congestion and lift over this will open up room for retest of resistance at the 1.1800/25 area. Clearance here will see room to retest the 1.1850 high and further retrace the January/March losses towards strong resistance at the 1.1900/30 area.