Published: 2025-06-27T02:30:35.000Z
Chart USD/SGD Update: Consolidating at 1.2717, fresh multi-year low

Technical Analyst
1
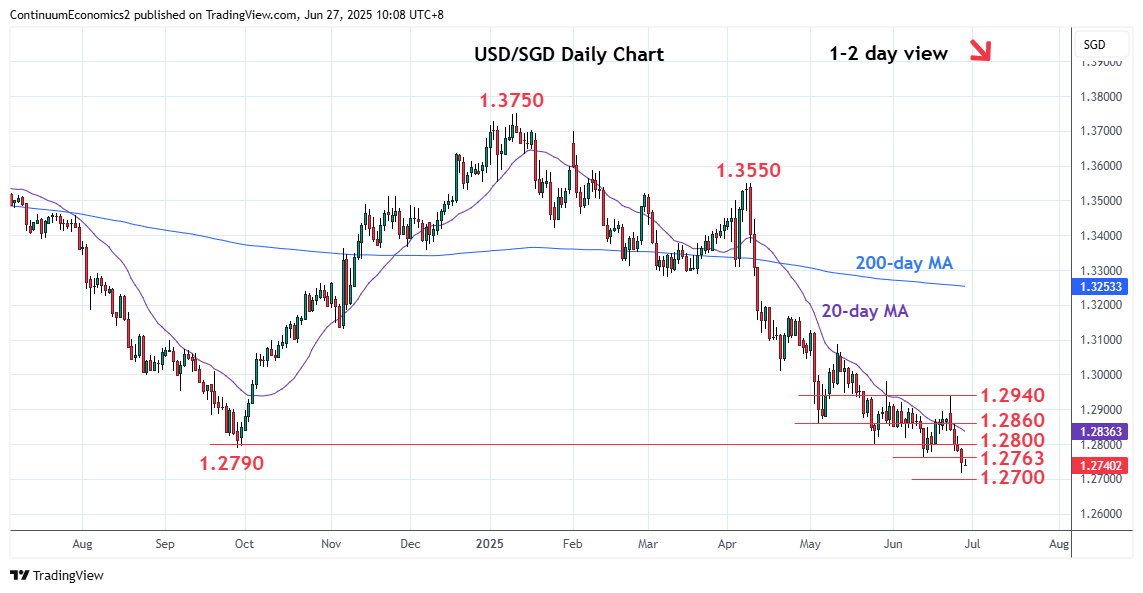
Break of the 1.2763 low extend sharp drop from the 1.2940 Monday's high to reach fresh year low at 1.2717
| Level | Comment | Level | Comment | ||||
|---|---|---|---|---|---|---|---|
| R4 | 1.2940 | ** | 23 Jun high | S1 | 1.2717 | ** | 26 Jun YTD low |
| R3 | 1.2900 | * | congestion | S2 | 1.2700 | * | congestion |
| R2 | 1.2860 | * | 5 May low | S3 | 1.2676 | * | Oct 2014 low |
| R1 | 1.2800 | * | 26 May low | S4 | 1.2600 | * | congestion |
Asterisk denotes strength of level
02:20 GMT - Break of the 1.2763 low extend sharp drop from the 1.2940 Monday's high to reach fresh year low at 1.2717. Consolidation here see prices unwinding oversold intraday studies with daily studies now into oversold areas as well and caution corrective bounce. Resistance is at the 1.2800 level and regaining here needed to clear the way for stronger bounce to resistance at 1.2860/1.2600 congestion. Below the 1.2717 low further extend losses from the multi-year top pattern at 1.4646, 2020 year high, to retrace 2011/2020 gains.