Published: 2026-05-15T07:33:28.000Z
Chart GBP/JPY Update: Under pressure
3
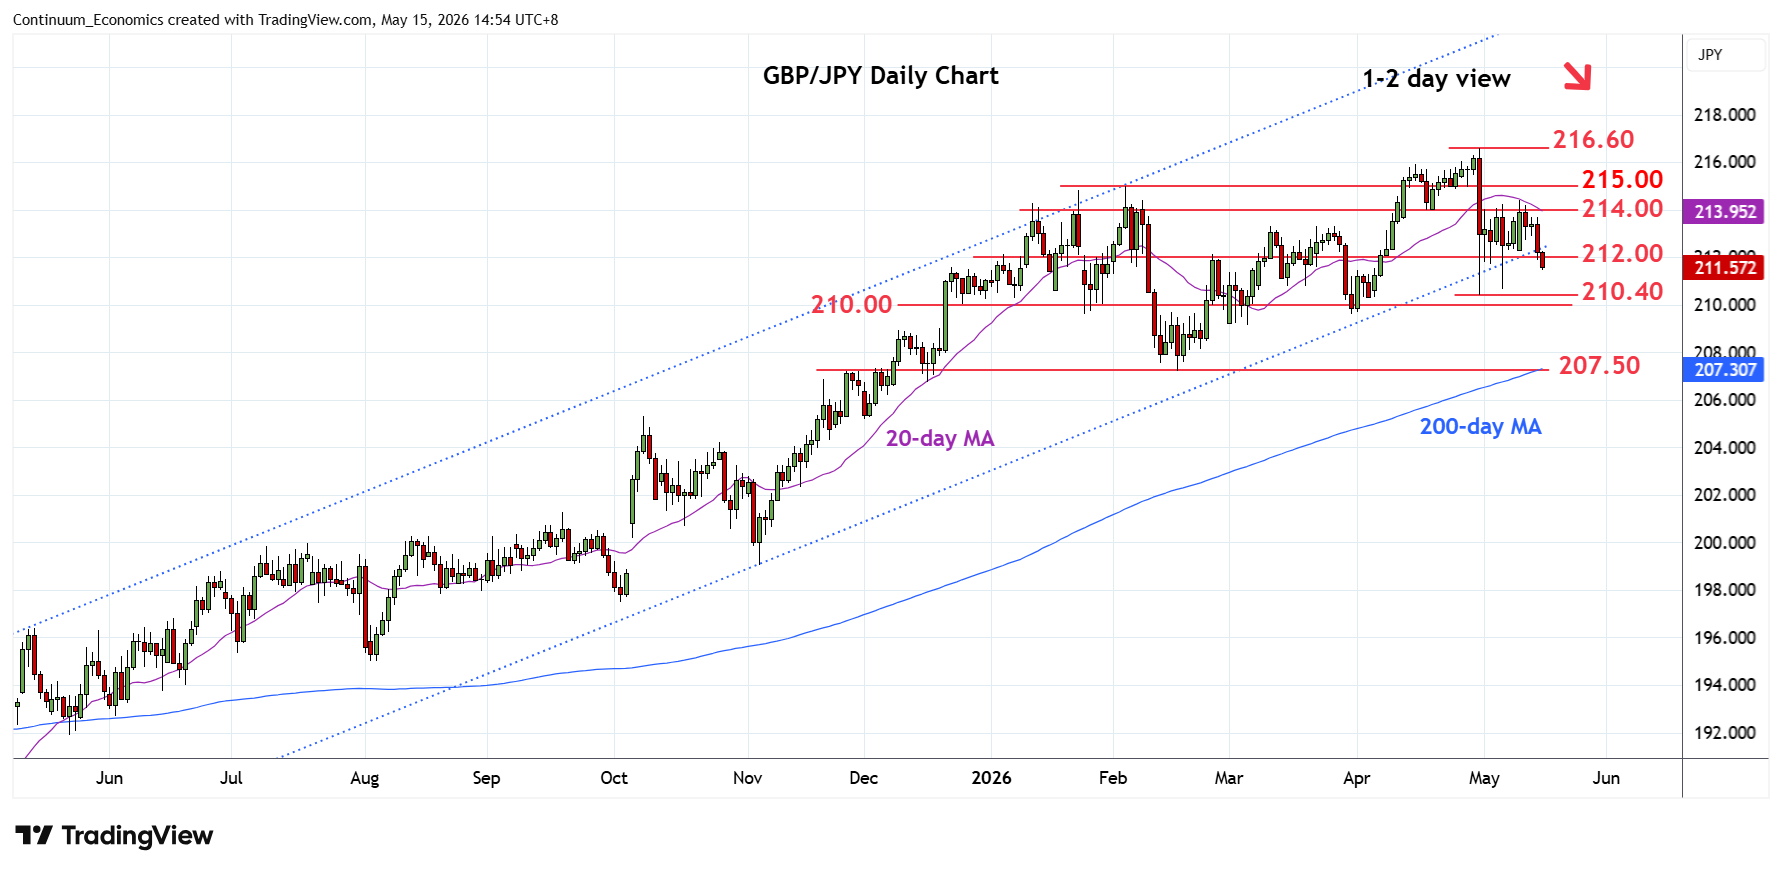
Choppy trade within the 212.00/214.00 range has given way to break lower as daily and weekly studies turned down from overbought areas
| Levels | Imp | Comment | Levels | Imp | Comment | |||
|---|---|---|---|---|---|---|---|---|
| R4 | 216.60 | ** | 30 Apr YTD high | S1 | 210.40 | ** | 30 Apr low | |
| R3 | 216.00 | * | congestion | S2 | 210.00 | * | congestion | |
| R2 | 215.00 | * | Feb high, congestion | S3 | 209.60/00 | * | Jan low, congestion | |
| R1 | 214.00 | * | 17 Apr low | S4 | 208.00 | * | congestion |
Asterisk denotes strength of level
07:25 GMT - Choppy trade within the 212.00/214.00 range has given way to break lower as daily and weekly studies turned down from overbought areas. Break opens up room for retest of support at 210.40/210.00, 30 April low and congestion area. Below this will see room to extend losses from the 216.60 April current year high to the 209.60/00 area and see potential for retest of the 208.00 congestion and 207.50, February current year low. Meanwhile, resistance at the 214.00 congestion is expected to cap and sustain losses from the April high.