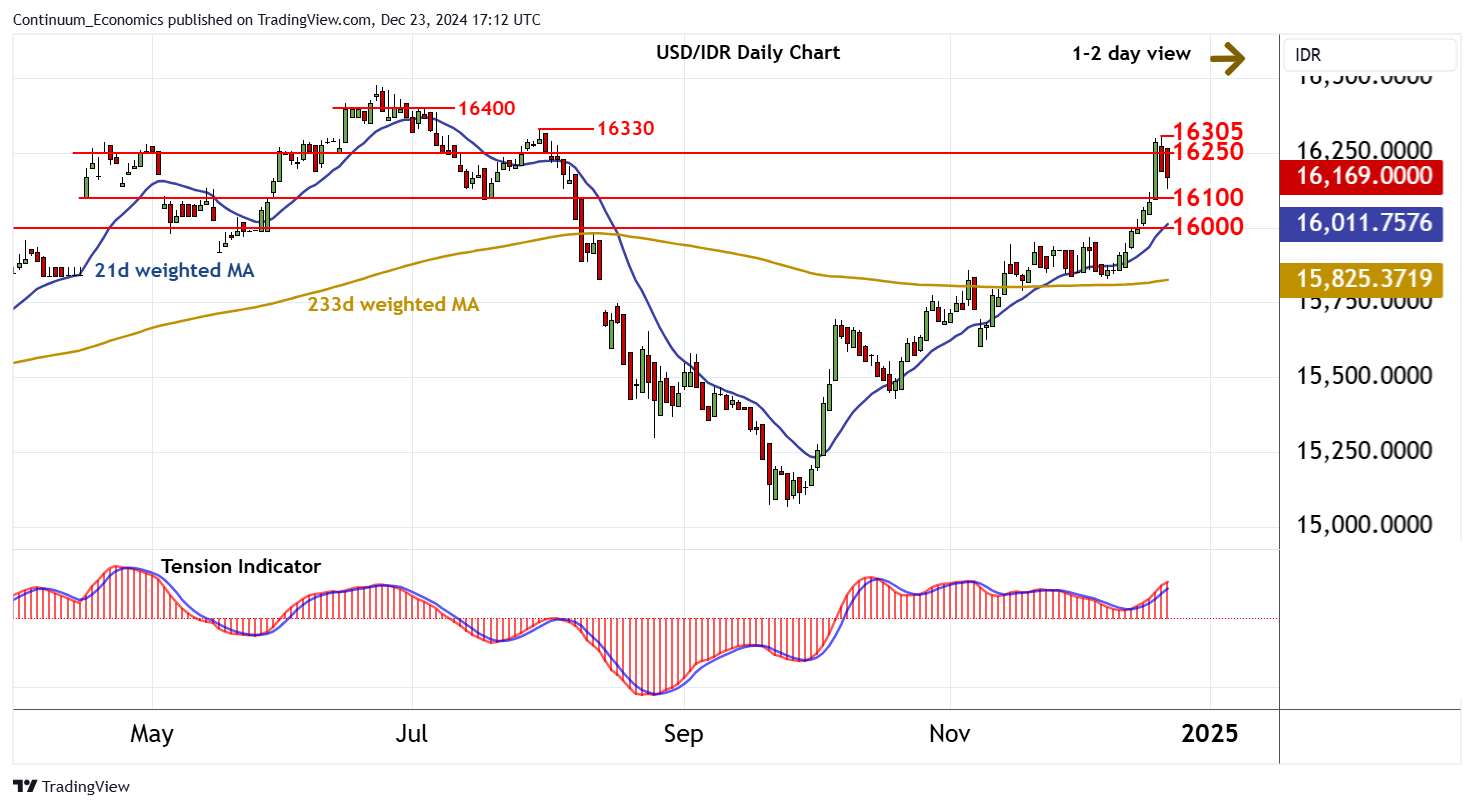
Chart USD/IDR Updates: Consolidating

The pullback from the 16305 weekly high of 20 December is meeting buying interest just above congestion support at 16100

| Levels | Imp | Comment | Levels | Imp | Comment | |||
|---|---|---|---|---|---|---|---|---|
| R4 | 16400 | * | congestion | S1 | 16100 | * | congestion | |
| R3 | 16330 | * | 30 Jul high | S2 | 16000 | * | figure, congestion | |
| R2 | 16305 | * | 20 Dec (w) high | S3 | 15969 | ** | 4 Dec high | |
| R1 | 16250 | * | congestion | S4 | 15969 | ** | 4 Dec high |
Asterisk denotes strength of level
17:00 GMT - The pullback from the 16305 weekly high of 20 December is meeting buying interest just above congestion support at 16100, with prices currently trading around 16170. Overbought daily stochastics are unwinding, highlighting potential for a test beneath here towards further congestion around 16000. But the rising daily Tension Indicator and positive weekly charts are expected to limit any tests of here in renewed buying interest. Meanwhile, resistance is at congestion around 16250 and extends to 16305. A close above here is needed, not yet seen, to turn sentiment positive and confirm continuation of September gains.