Continuum Economics
  • Search
  • About Us
  • Buy
  • Invite A Friend
  • My Basket
  • Articles
  • Calendar
  • Forecasts
  • Events
  • Data
  • Newsletters
  • My Alerts
  • Community
  • Directory
  • About Us
  • Buy
  • Invite A Friend
  • My Basket
  • Articles
    • All
    • Thematic
    • Tactical
    • Asia
    • EMEA
    • Americas
    • Newsletters
    • Freemium
    • Editor's Choice
    • Most Viewed
    • Most Shared
    • Most Liked
  • Calendar
    • Interactive
      • China
      • United States
      • Eurozone
      • United Kingdom
    • Month Ahead
    • Reviews
    • Previews
  • Forecasts
    • Forecasts
    • Key Views
  • Events
    • Media
    • Conference Calls
  • Data
    • Country Insights
    • Shadow Credit Ratings
    • Full CI Data Download
  • Newsletters
  • My Alerts
  • Community
    • FX
    • Fixed Income
    • Macro Strategy
    • Credit Markets
    • Equities
    • Commodities
    • Precious Metals
    • Renewables
  • Directory
  • My Account
  • Notifications Setup
  • Account Details
  • Recent Devices
  • Distribution Lists
  • Shared Free Trials
  • Saved Articles
  • Shared Alerts
  • My Posts
Published: 2025-06-19T15:43:59.000Z

Chartbook: Chart EUR/USD: Potential for a pullback before September 2022 gains continue

byMike Macdonald

Senior Technical Strategist
3

Anticipated gains have broken above the 1.1275 year high of July 2023 and the falling trendline from the July 2008 year high around 1.6050

Anticipated gains have broken above the 1.1275 year high of July 2023 and the falling trendline from the July 2008 year high around 1.6050,

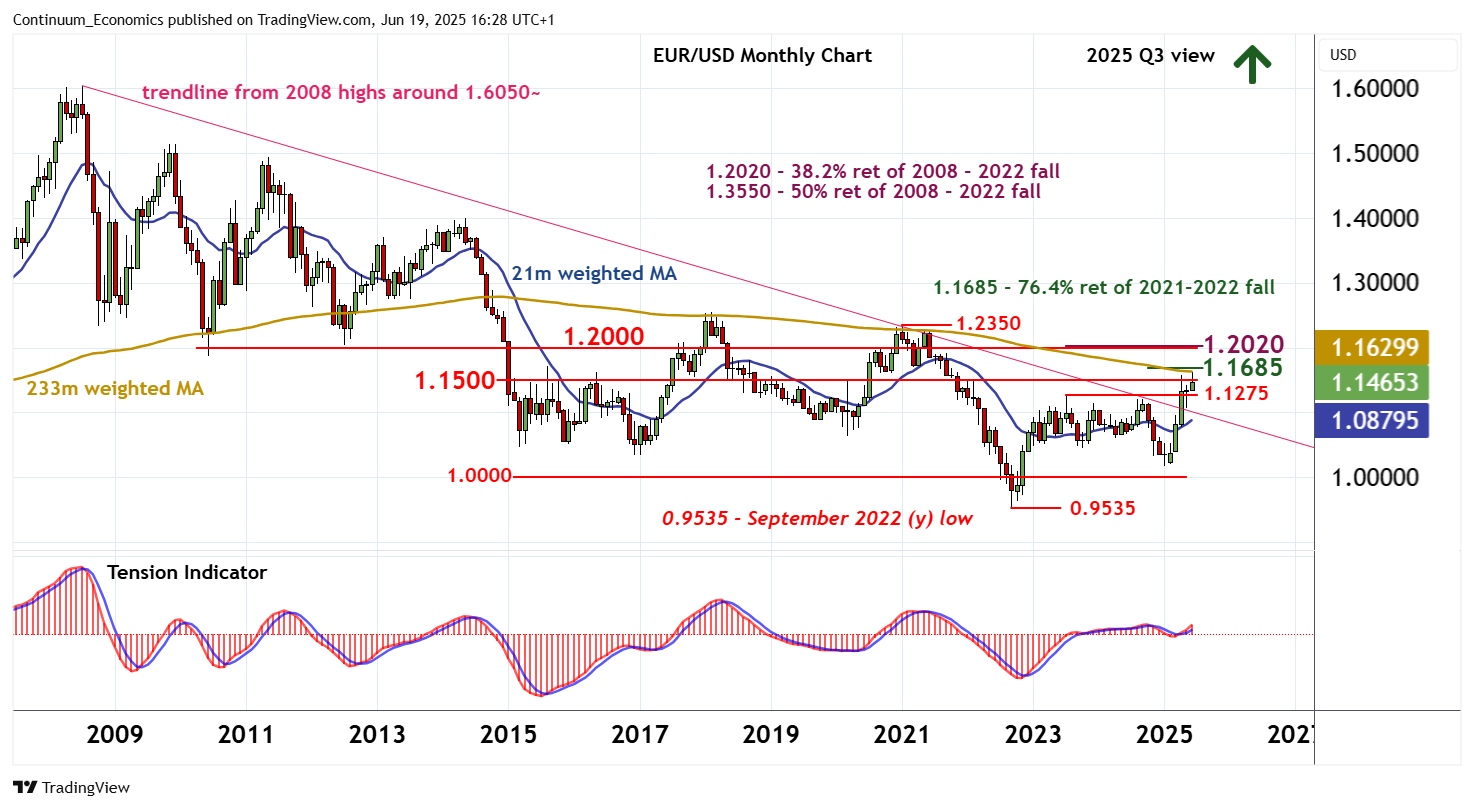
with prices testing above congestion around 1.1500 before settling back beneath here.

Monthly stochastics and the monthly Tension Indicator continue to rise, and longer-term readings are also positive, highlighting a positive tone and room for continuation of gains from the 0.9535 multi-year low of September 2022.

A break back above 1.1500 will open up strong resistance at the 1.1685 Fibonacci retracement. A close above here will further improve already positive price action and extend gains towards stronger resistance at congestion around 1.2000 and the 1.2020 multi-year Fibonacci retracement. By-then overbought monthly stochastics could limit any immediate tests in consolidation, before improving longer-term readings prompt a break towards the 1.2350 year high of January 2021.

Meanwhile, support is at congestion around 1.1300.

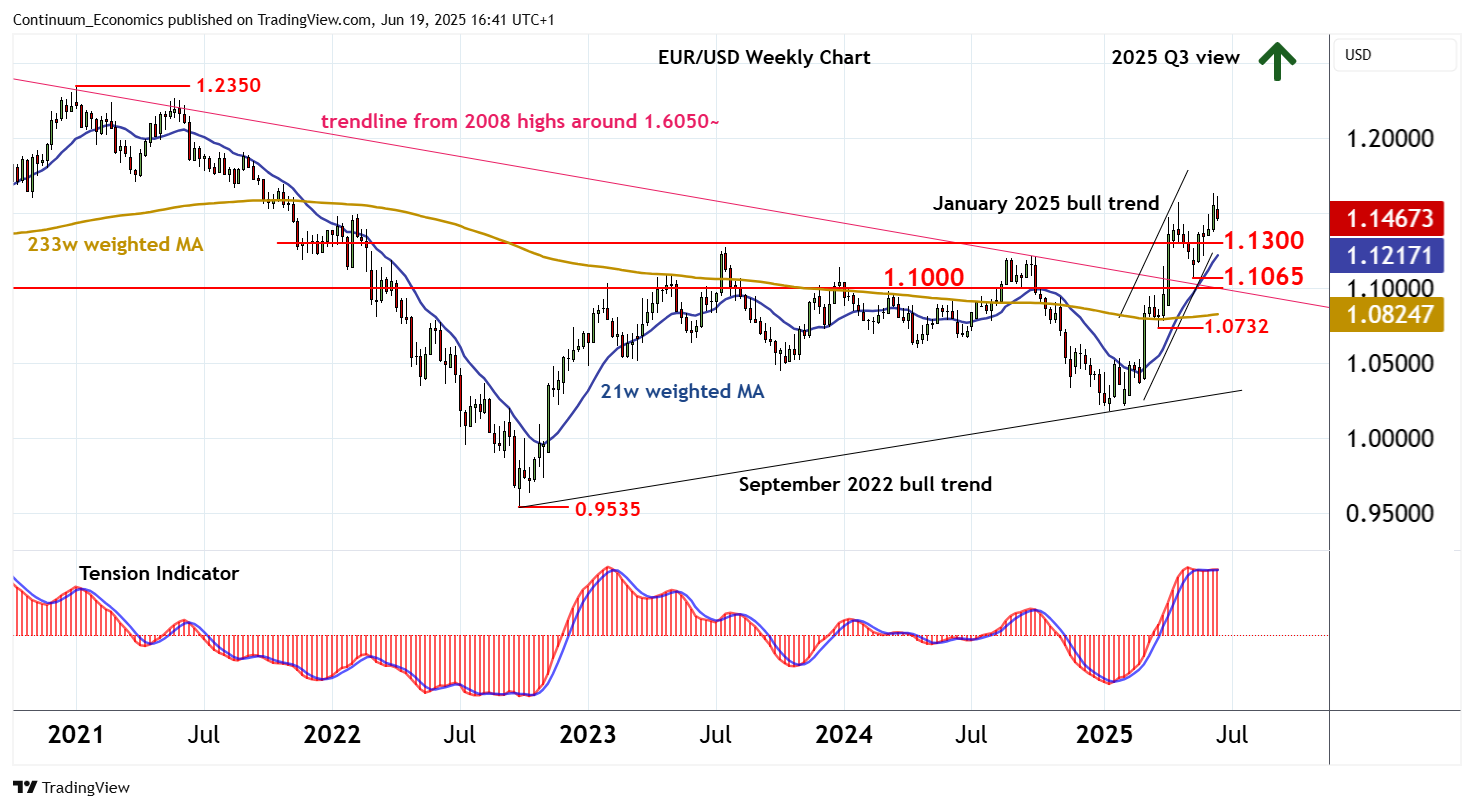
A tick lower in weekly studies suggests potential for a pullback towards here, before fresh gains are seen.

A break will open up strong support at congestion around 1.1000 and the 1.1065 monthly low of 12 May. This range needs to underpin any tests to keep the January 2025 bull trend intact.

A close beneath here would add weight to sentiment and extend losses towards the 1.0732 weekly low of 27 March.

Continue to read the article for free
Login

or

or

Topics
EUR/USD-TA
Technical Analysis
ChartBook

GENERAL

  • Home
  • About Us
  • Our Team
  • Careers

LEGAL

  • Terms and Conditions
  • Privacy Policy
  • Compliance
  • GDPR

GET IN TOUCH

  • Contact Us
Continuum Economics
The Technical Analyst Awards Winner 2021
The Technical Analyst Awards Finalist 2020
image