Published: 2026-05-06T01:06:01.000Z
Chart USD/JPY Update: Consolidating sharp losses last week
1
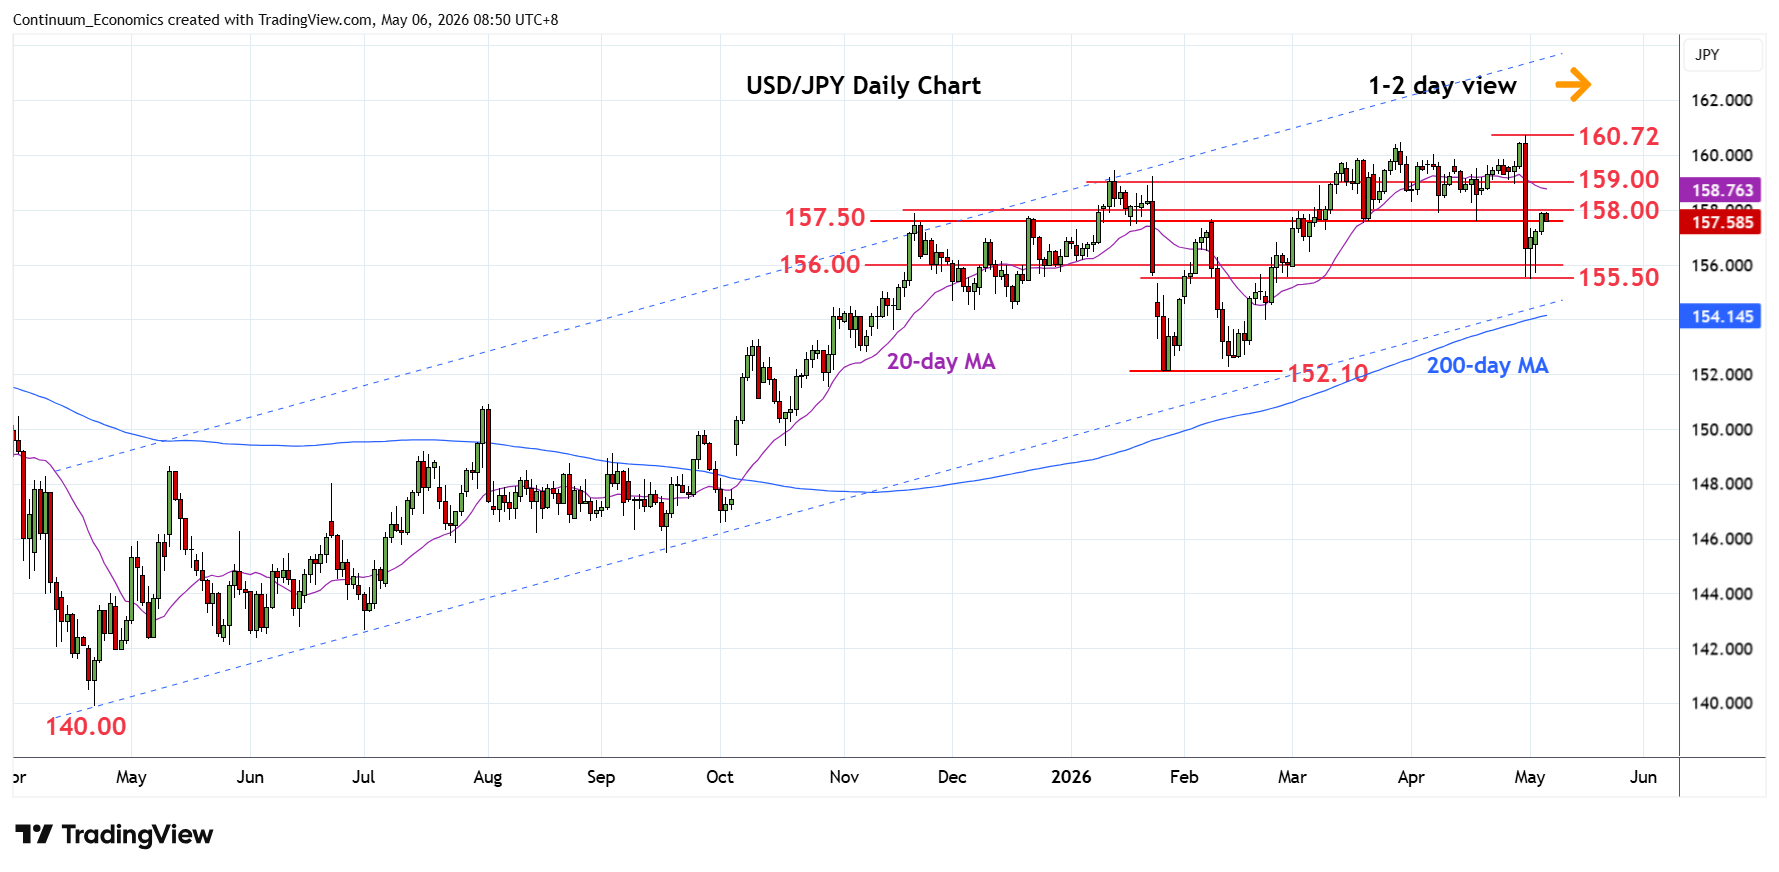
Higher in consolidation as prices extend bounce from the 156.00/155.50 support to reach strong resistance at 157.50/158.00
| Levels | Imp | Comment | Levels | Imp | Comment | |||
|---|---|---|---|---|---|---|---|---|
| R4 | 159.45 | * | Jan high | S1 | 156.00 | * | congestion | |
| R3 | 159.00 | ** | congestion | S2 | 155.50 | ** | congestion | |
| R2 | 158.00 | ** | congestion | S3 | 154.50 | * | congestion | |
| R1 | 157.50 | ** | 19 Mar low | S4 | 154.05/00 | ** | 200-day MA, congestion |
Asterisk denotes strength of level
00:50 GMT - Higher in consolidation as prices extend bounce from the 156.00/155.50 support to reach strong resistance at the 157.50/158.00 area which is expected to cap. Clearance, if seen, will open up room for stronger bounce to the 159.00 level. However, corrective gains are expected to give way to renewed selling pressure later to retest the 156.00 level and 155.50 congestion. Below these will see room for extension to 155.00 level. Lower still, will see scope to support at the 154.10/154.00, 200-day MA and congestion area.