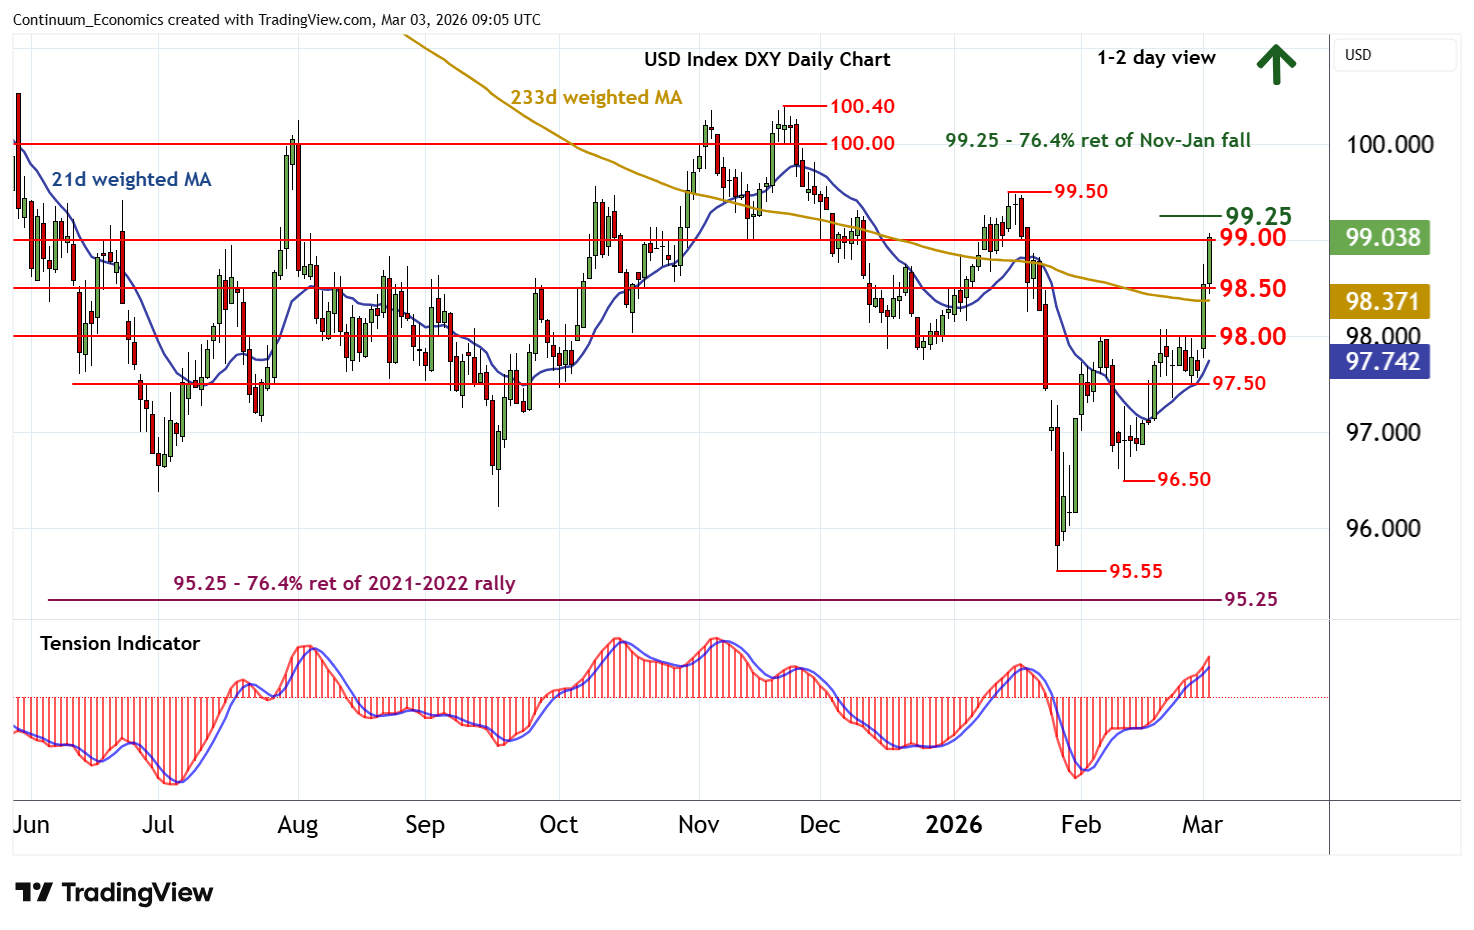
Chart USD Index DXY Update: Reached resistance at 99.00/25
Cautious trade has given way to fresh gains, as intraday studies continue to rise
| Levels | Imp | Comment | Levels | Imp | Comment | |||
|---|---|---|---|---|---|---|---|---|
| R4 | 100.00 | ** | congestion | S1 | 98.50 | * | congestion | |
| R3 | 99.50 | ** | 15 Jan YTD high, cong | S2 | 98.00 | * | congestion | |
| R2 | 99.25 | ** | 76.4% ret of Nov-Jan fall | S3 | 97.50 | ** | congestion | |
| R1 | 99.00 | ** | congestion | S4 | 97.00 | * | congestion |
Asterisk denotes strength of level
09:10 GMT - Cautious trade has given way to fresh gains, as intraday studies continue to rise, with prices currently pressuring resistance at congestion around 99.00 and the 99.25 Fibonacci retracement. Daily readings are positive and broader weekly charts are rising, highlighting room for a break and continuation of late-January gains towards the 99.50 current year high of 15 January. However, already overbought intraday and daily stochastics could limit any initial tests in consolidation, before gains extend still further. Meanwhile, support is raised to congestion around 98.50. An unexpected close beneath here will help to stabilise price action and prompt consolidation above further congestion around 98.00.