Chart USD/RUB Update: Consolidating above fresh year low
The anticipated continuation of mid-March losses has posted a fresh 2026 year low at 74.4050
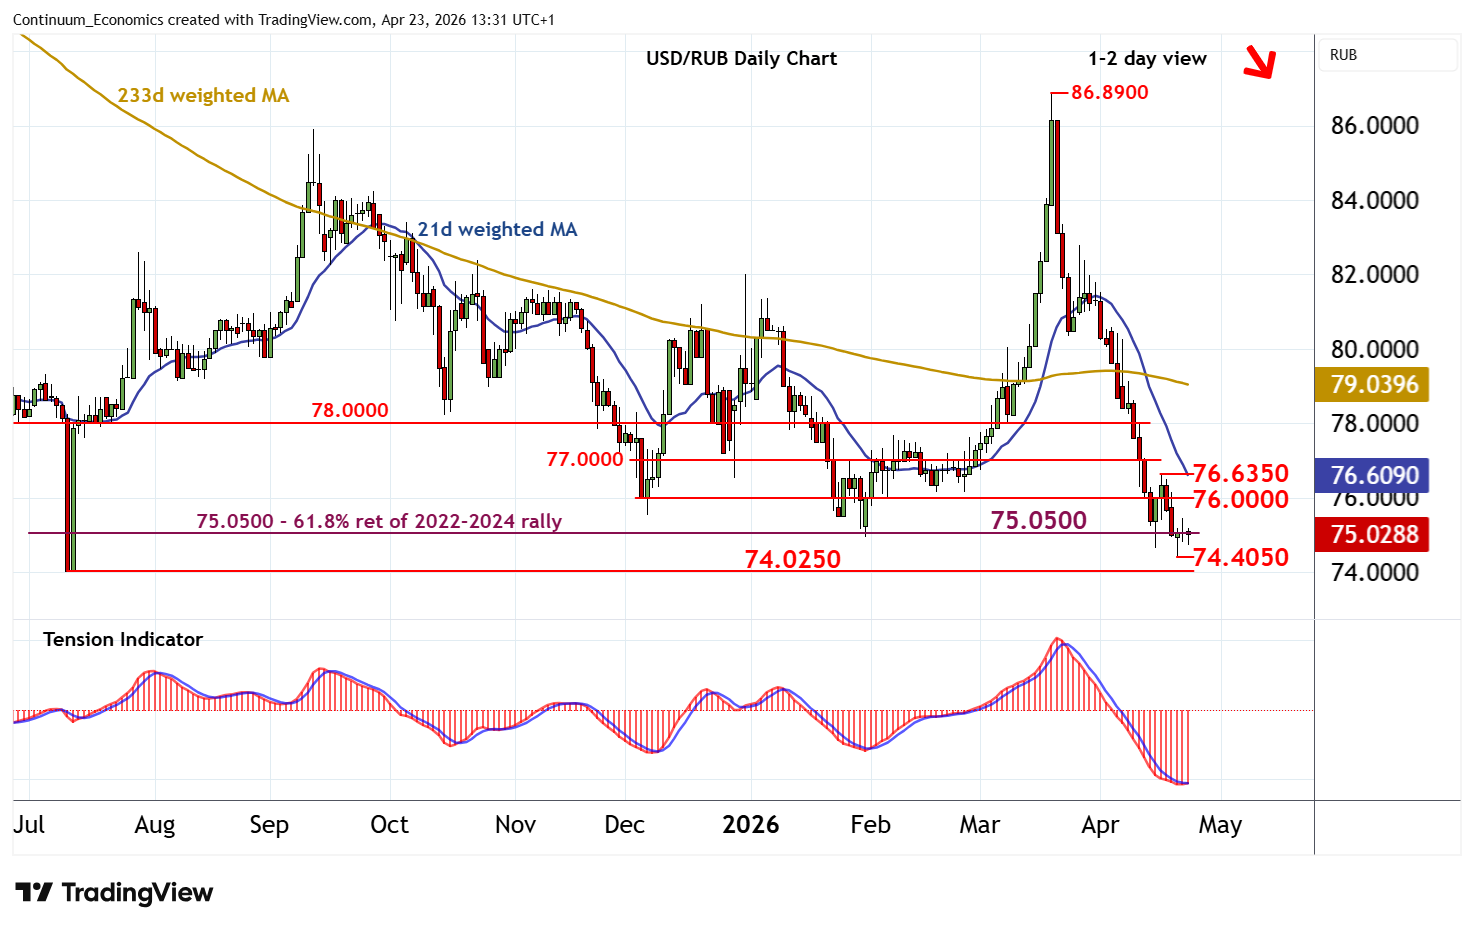
| Levels | Comment | Levels | Comment | |||||
| R4 | 78.0000 | * | congestion | S1 | 75.0500 | ** | 76.4% ret of 2022-2024 rally | |
| R3 | 77.0000 | ** | congestion | S2 | 74.4050 | * | 21 Apr YTD low | |
| R2 | 76.6350 | 16 Apr high | S3 | 74.0250 | ** | 10 Jul 2025 (y) low | ||
| R1 | 76.0000 | * | congestion | S4 | 72.6800 | * | late-Feb 2023 (w) low |
Asterisk denotes strength of level
12:30 BST - The anticipated continuation of mid-March losses has posted a fresh 2026 year low at 74.4050, before bouncing sharply into consolidation around the 75.0500 multi-month Fibonacci retracement. Oversold daily stochastics are flattening and the bearish daily Tension Indicator is flattening, suggesting room for further gains towards congestion resistance at 76.0000. But negative weekly charts should prompt renewed selling interest towards here. Following cautious trade, fresh losses are looked for. A break below 74.4050 will open up the 74.0250 year low of 10 July 2025. A further close beneath here will turn sentiment negative and extend November 2024 losses into 3-year lows.