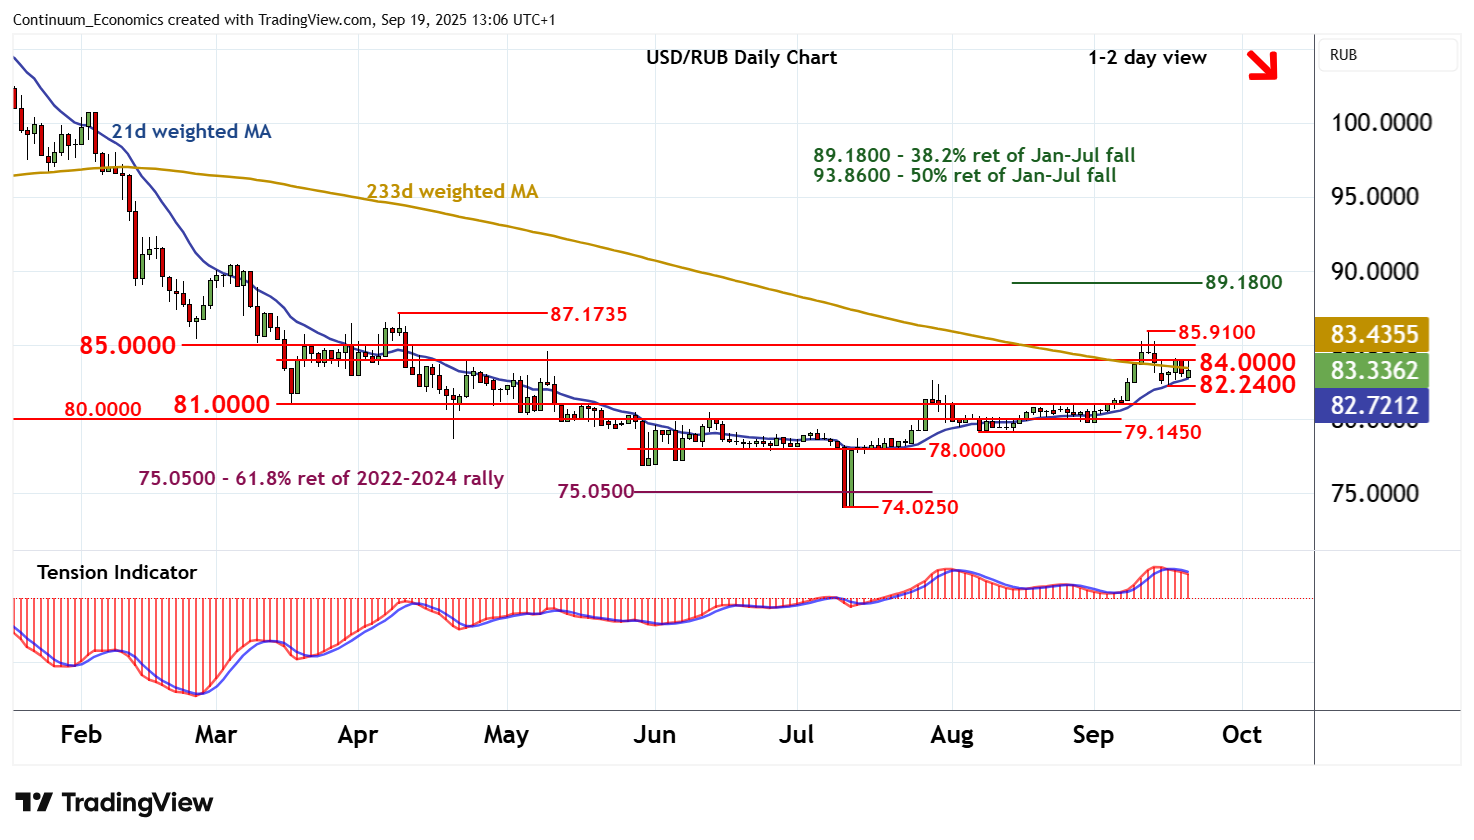
Chart USD/RUB Update: Consolidating - daily studies under pressure
The pullback from the 85.9100 weekly high of 11 September is giving way to consolidation above the 82.240 weekly low of 16 September
| Levels | Comment | Levels | Comment | |||||
| R4 | 87.1735 | ** | 9 Apr (m) high | S1 | 82.2400 | ** | 16 Sep (w) low | |
| R3 | 85.9100 | ** | 11 Sep (w) high | S2 | 81.0000 | * | break level | |
| R2 | 85.0000 | ** | congestion | S3 | 80.0000 | ** | congestion | |
| R1 | 84.0000 | * | congestion | S4 | 79.1450 | ** | 7 Aug (w) range low |
Asterisk denotes strength of level
12:55 BST - The pullback from the 85.9100 weekly high of 11 September is giving way to consolidation above the 82.240 weekly low of 16 September. Daily stochastics and the daily Tension Indicator are falling, highlighting room for further losses in the coming sessions. A break below 82.2400 will open up further support within the 80.0000 - 81.0000 range. But rising weekly charts are expected to limit any tests of this range in renewed buying interest/consolidation. Meanwhile, resistance is at congestion around 84.0000 and extends to 85.000. However, a close above 85.9100 is needed to turn sentiment positive and confirm continuation of July gains, initially to the 87.1735 monthly high of 9 April.