Published: 2026-04-07T06:53:52.000Z
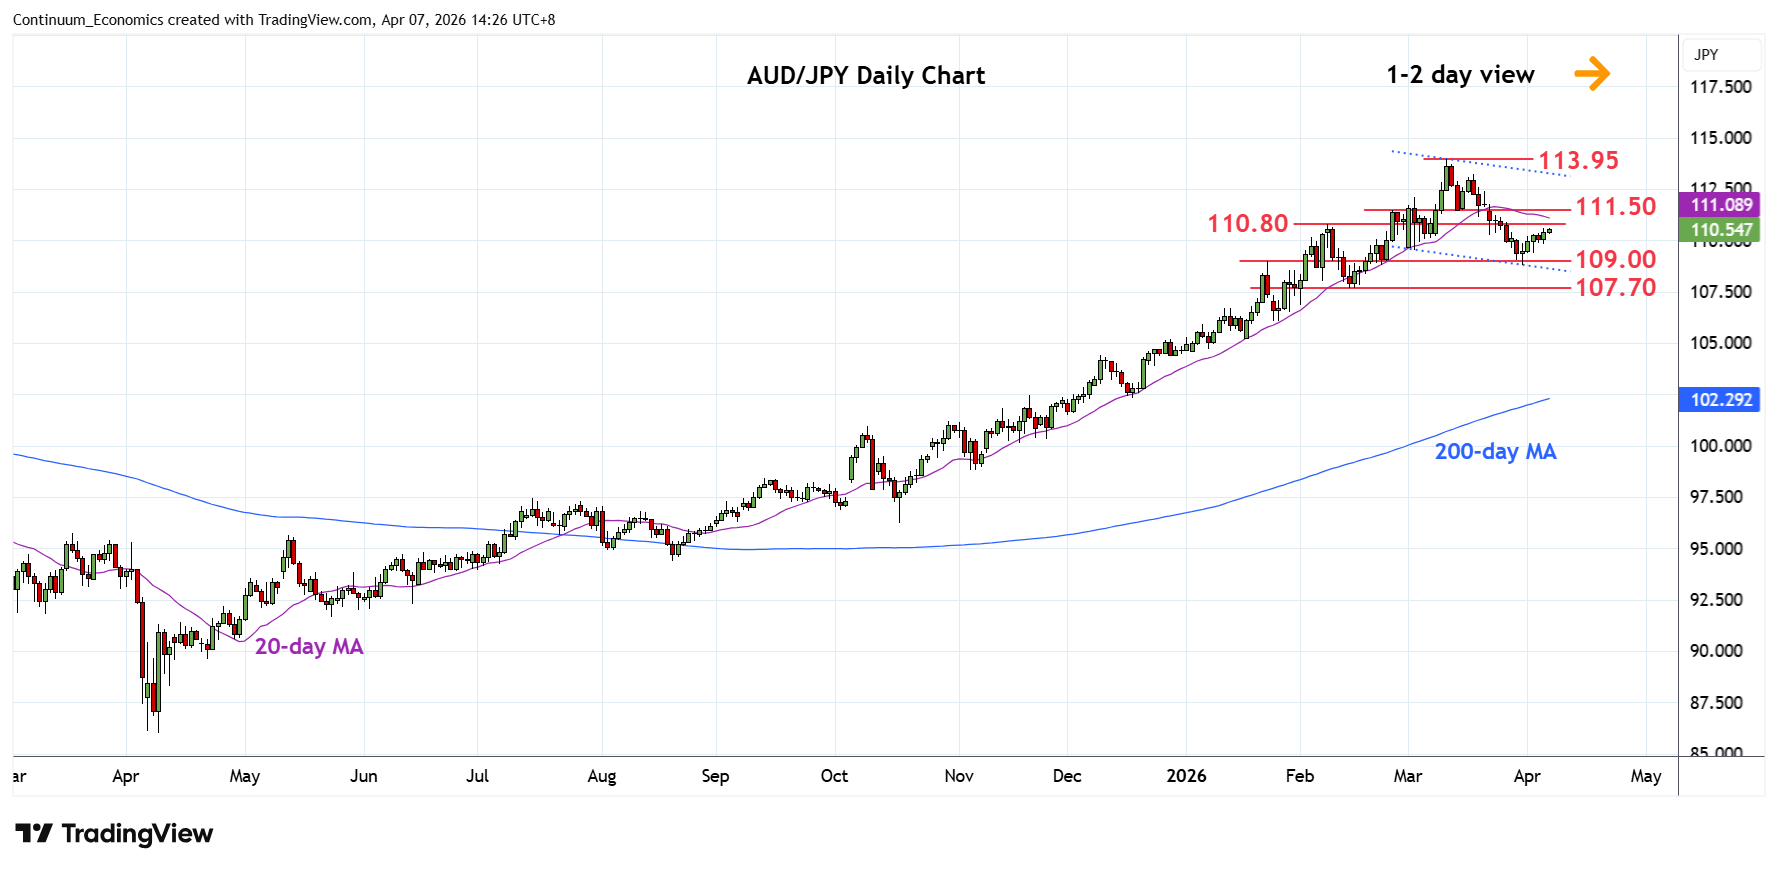
Chart AUD/JPY Update: Higher in consolidation from 109.00 support
2
Extend bounce from the 109.00 support to regain the 110.00 level as prices consolidate losses from the 113.95, 11 March current year high
| Levels | Imp | Comment | Levels | Imp | Comment | |||
|---|---|---|---|---|---|---|---|---|
| R4 | 113.95 | ** | 11 Mar YTD high | S1 | 109.00 | ** | Jan high | |
| R3 | 113.20 | * | 18 Mar high | S2 | 107.70 | * | 13 Feb low | |
| R2 | 111.50 | ** | 13 Mar low | S3 | 107.20 | * | 38.2% Oct/Mar rally | |
| R1 | 110.80 | * | 9 Feb high | S4 | 106.00 | * | congestion |
Asterisk denotes strength of level
06:45 GMT - Extend bounce from the 109.00 support to regain the 110.00 level as prices consolidate losses from the 113.95, 11 March current year high. Nearby see reistance at 110.80 and regaining this will open up room for stronger gains to resistance at the 111.50/112.00 area which is expected to cap. Lower high sought to further pressure the downside later and break of the 109.00 level will see room for deeper pullback to retrace the October/March rally to support at the 108.00/107.70 area. Below this, will see room to 107.20, 38.2% Fibonacci level.