Published: 2025-12-24T08:56:17.000Z
Chart USD Index DXY Update: Pressuring support at 97.80/00
2
Little change, as prices extend pressure on support within the 97.80 Fibonacci retracement and congestion around 98.00
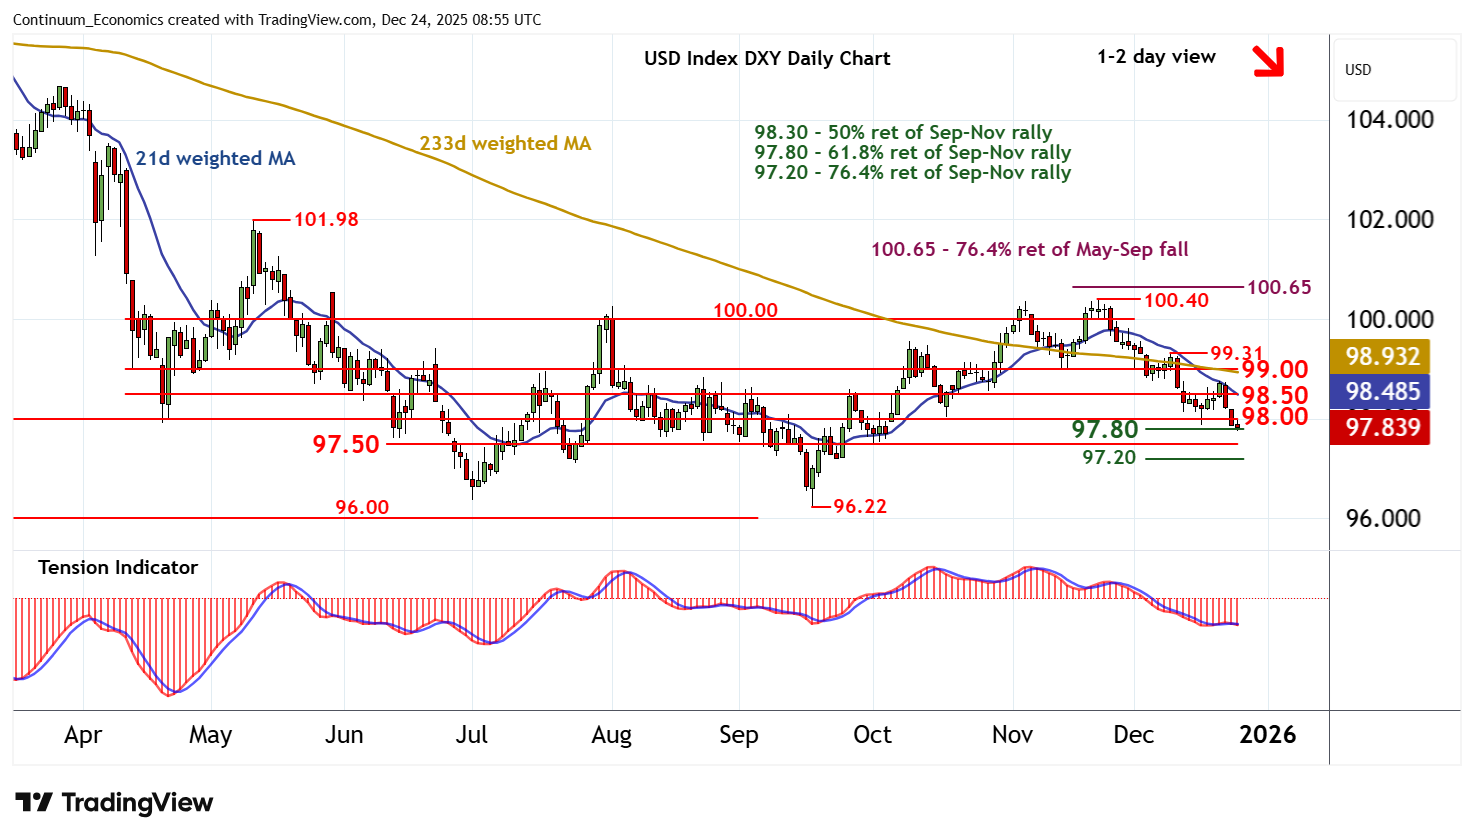
| Levels | Imp | Comment | Levels | Imp | Comment | |||
|---|---|---|---|---|---|---|---|---|
| R4 | 99.50 | * | break level | S1 | 98.00 | * | congestion | |
| R3 | 99.31 | * | 9 Dec (w) high | S2 | 97.80 | ** | 61.8% ret of Sep-Nov rally | |
| R2 | 99.00 | * | congestion | S3 | 97.50 | congestion | ||
| R1 | 98.50 | * | congestion | S4 | 97.20 | ** | 76.4% ret of Sep-Nov rally |
Asterisk denotes strength of level
08:50 GMT - Little change, as prices extend pressure on support within the 97.80 Fibonacci retracement and congestion around 98.00. Intraday studies are edging higher, suggesting room for a minor bounce. But negative daily readings and deteriorating weekly charts are expected to limit scope in renewed selling interest beneath congestion resistance at 98.50. In the coming sessions, further losses are looked for. A close below 97.80 will add weight to sentiment and extend November losses initially towards congestion around 97.50.