Published: 2026-01-20T06:53:32.000Z
Chart AUD/JPY Update: Extending April gains
-
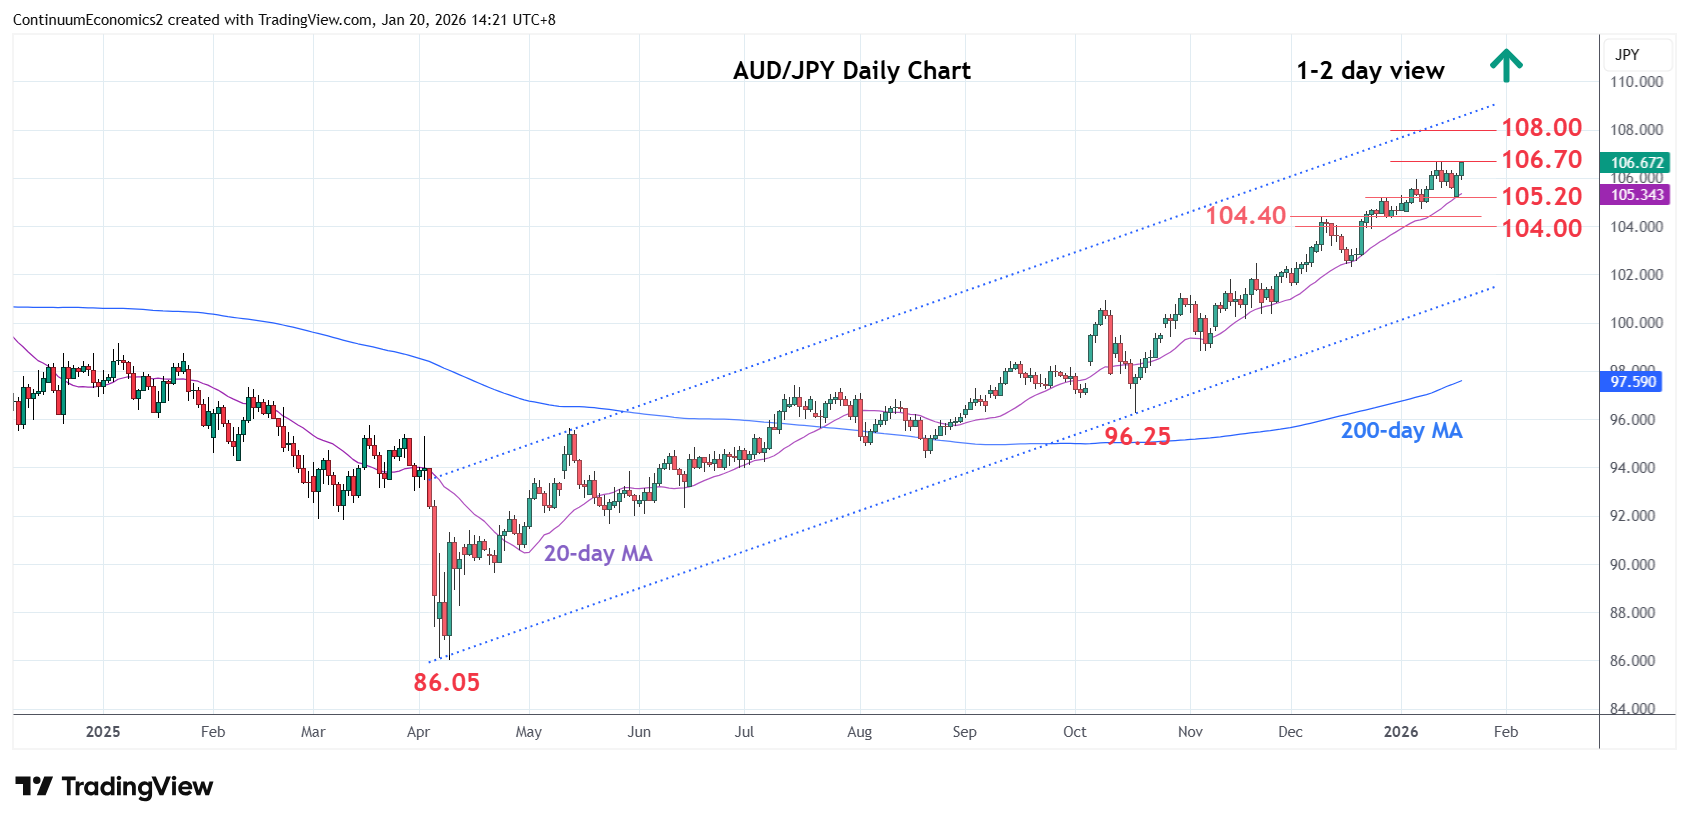
Bounce from the 105.20 support to regain the 106.00 level see prices back to retest the 106.70 high
| Levels | Imp | Comment | Levels | Imp | Comment | |||
|---|---|---|---|---|---|---|---|---|
| R4 | 109.70 | ** | Mar 1991 year high | S1 | 105.20/00 | * | 29 Dec high, congestion | |
| R3 | 109.35 | ** | Jul 2024 year high | S2 | 104.40 | ** | 9 Dec high | |
| R2 | 108.00 | * | congestion | S3 | 104.00 | * | congestion | |
| R1 | 106.70 | ** | 14 Jan YTD high | S4 | 103.00 | * | congestion |
Asterisk denotes strength of level
06:45 GMT - Bounce from the 105.20 support to regain the 106.00 level see prices back to retest the 106.70 high. Break here will further extend gains within the bullish channel from the April low and see room to the 108.00 level. Beyond this will return focus to the 109.35, the July 2024 multi-year high. Would expect reaction at the latter but a later break cannot be ruled out. Meanwhile, support at the 105.20/00 should underpin. Would take break here to open up room for deeper pullback to strong support at the 104.40/104.00 congestion area.