Published: 2026-02-06T06:57:31.000Z
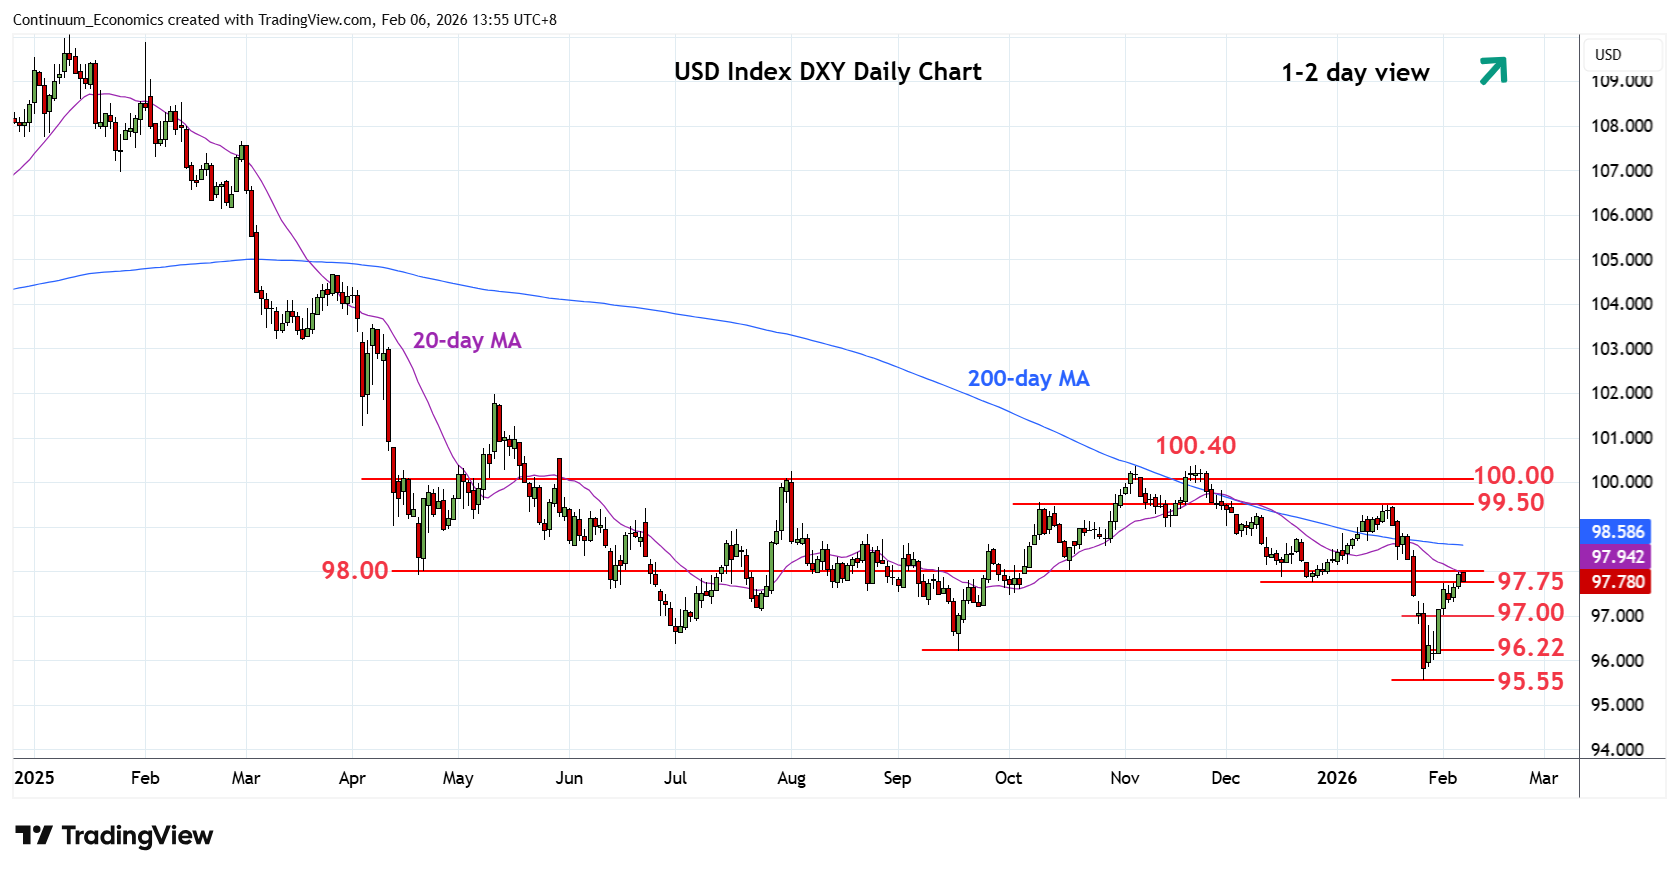
Chart USD Index DXY Update: Consolidating at 98.00 Fibonacci level
7
Settling back from test of strong resistance at the 97.75/98.00 area and 61.8% Fibonacci level
| Levels | Imp | Comment | Levels | Imp | Comment | |||
|---|---|---|---|---|---|---|---|---|
| R4 | 99.50 | ** | congestion, Jan high | S1 | 97.30 | * | 3 Feb low | |
| R3 | 99.00 | * | congestion | S2 | 97.00 | * | congestion | |
| R2 | 98.50/55 | * | congestion, 76.4% | S3 | 96.50 | * | congestion | |
| R1 | 98.00 | ** | congestion, 61.8% | S4 | 96.22 | ** | Sep 2025 year low |
Asterisk denotes strength of level
06:50 GMT - Settling back from test of strong resistance at the 97.75/98.00 area and 61.8% Fibonacci level. Daily studies are still tracking higher and break here cannot be ruled out to further retrace the January losses. Higher still, if seen, will see room for extension to the 98.55, 76.4% Fibonacci level. Meanwhile, support at the 97.30/97.00 congestion area now underpin. Would take break here to return focus to the downside for retest of the 96.22 and 95.55, September 2025 year low and January current year low.