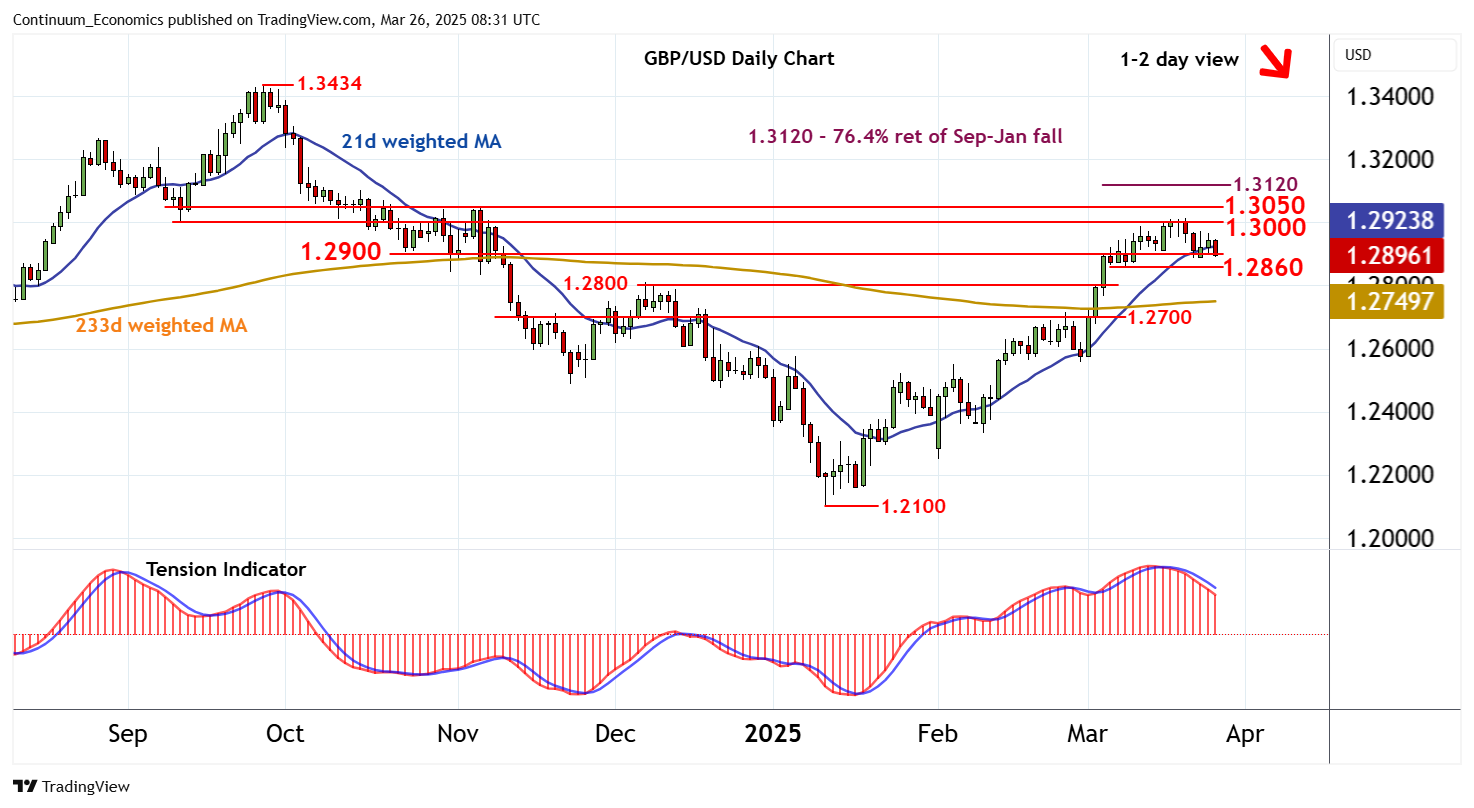
Chart GBP/USD Update: Leaning lower

Cautious trade is giving way to a test lower

| Level | Comment | Level | Comment | |||||
|---|---|---|---|---|---|---|---|---|
| R4 | 1.3200 | * | break level | S1 | 1.2900 | ** | congestion | |
| R3 | 1.3100/20 | * | cong; 76.4% ret of Sep-Jan fall | S2 | 1.2860 | * | 6-10 Mar lows | |
| R2 | 1.3050 | * | break level | S3 | 1.2800 | ** | congestion | |
| R1 | 1.3000 | ** | break level | S4 | 1.2700 | * | congestion |
Asterisk denotes strength of level
08:10 GMT - Cautious trade is giving way to a test lower, as intraday studies turn down, with prices currently pressuring congestion support at 1.2900. Daily readings are under pressure and overbought weekly stochastics are turning down, highlighting room for a break beneath here towards the 1.2860 low from 6-10 March. A close beneath here will complete a minor distribution top below 1.3000 and add weight to sentiment, as focus then turns to congestion around 1.2800. However, the rising weekly Tension Indicator could prompt fresh buying interest/consolidation around here. Meanwhile, resistance remains at 1.3000. A close above here, not yet seen, will improve price action and extend January gains beyond 1.3050 towards the 1.3120 Fibonacci retracement. Already overbought weekly stochastics could limit any initial tests in profit-taking/consolidation.