Published: 2025-09-11T02:22:33.000Z
Chart USD/SGD Update: Consolidating at 1.2800/1.2790 support
0
-
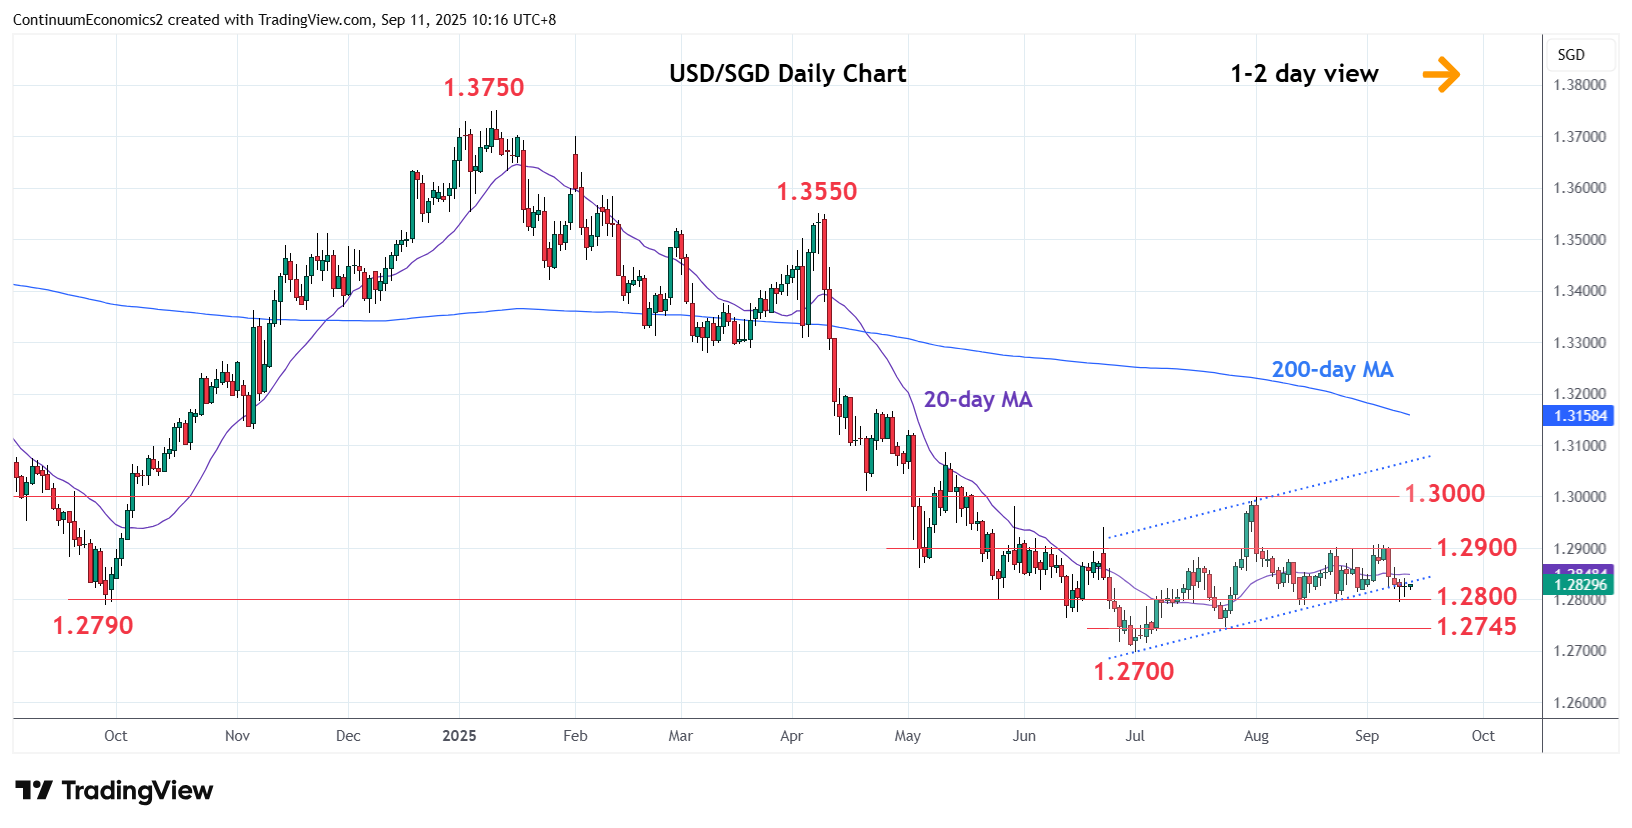
Little change, as prices edged up from test of support at the 1.2800/1.2790 August and 2024 year lows
| Level | Comment | Level | Comment | ||||
|---|---|---|---|---|---|---|---|
| R4 | 1.3000/10 | ** | Aug high, 21 Apr low | S1 | 1.2800/90 | * | Aug, 2024 year lows |
| R3 | 1.2940 | * | Jun high | S2 | 1.2745 | * | 24 Jul low |
| R2 | 1.2900 | ** | congestion | S3 | 1.2700 | ** | 1 Jul YTD low |
| R1 | 1.2850 | * | congestion | S4 | 1.2650 | * | congestion |
Asterisk denotes strength of level
02:20 GMT - Little change, as prices edged up from test of support at the 1.2800/1.2790, August and 2024 year lows. Bounce here see prices unwinding oversold intraday studies but the negative daily and weekly studies highlights risk for a later break to extend losses from the 1.3000, August swing high. Lower will turn focus to the 1.2745 support and see potential for extension to retest the 1.2700, July current year low. Meanwhile, resistance at the 1.2850/60 congestion area is expected to cap and sustain losses from the 1.2900 congestion.