Continuum Economics
  • Search
  • About Us
  • Buy
  • Invite A Friend
  • My Basket
  • Articles
  • Calendar
  • Forecasts
  • Events
  • Data
  • Newsletters
  • My Alerts
  • Community
  • Directory
  • About Us
  • Buy
  • Invite A Friend
  • My Basket
  • Articles
    • All
    • Thematic
    • Tactical
    • Asia
    • EMEA
    • Americas
    • Newsletters
    • Freemium
    • Editor's Choice
    • Most Viewed
    • Most Shared
    • Most Liked
  • Calendar
    • Interactive
      • China
      • United States
      • Eurozone
      • United Kingdom
    • Month Ahead
    • Reviews
    • Previews
  • Forecasts
    • Forecasts
    • Key Views
  • Events
    • Media
    • Conference Calls
  • Data
    • Country Insights
    • Shadow Credit Ratings
    • Full CI Data Download
  • Newsletters
  • My Alerts
  • Community
    • FX
    • Fixed Income
    • Macro Strategy
    • Credit Markets
    • Equities
    • Commodities
    • Precious Metals
    • Renewables
  • Directory
  • My Account
  • Notifications Setup
  • Administration Panel
  • Account Details
  • Recent Devices
  • Distribution Lists
  • Shared Free Trials
  • Saved Articles
  • Shared Alerts
  • My Posts
Back
Published: 2026-03-19T13:49:24.000Z

Chartbook: US Chart 10 Year Yield: Limited gains - background studies under pressure

1

The anticipated break lower has not been seen, as the test below congestion support at 4.000% gives way to a bounce from 3.926%

The anticipated break lower has not been seen, as the test below congestion support at 4.000% gives way to a bounce from 3.926%.

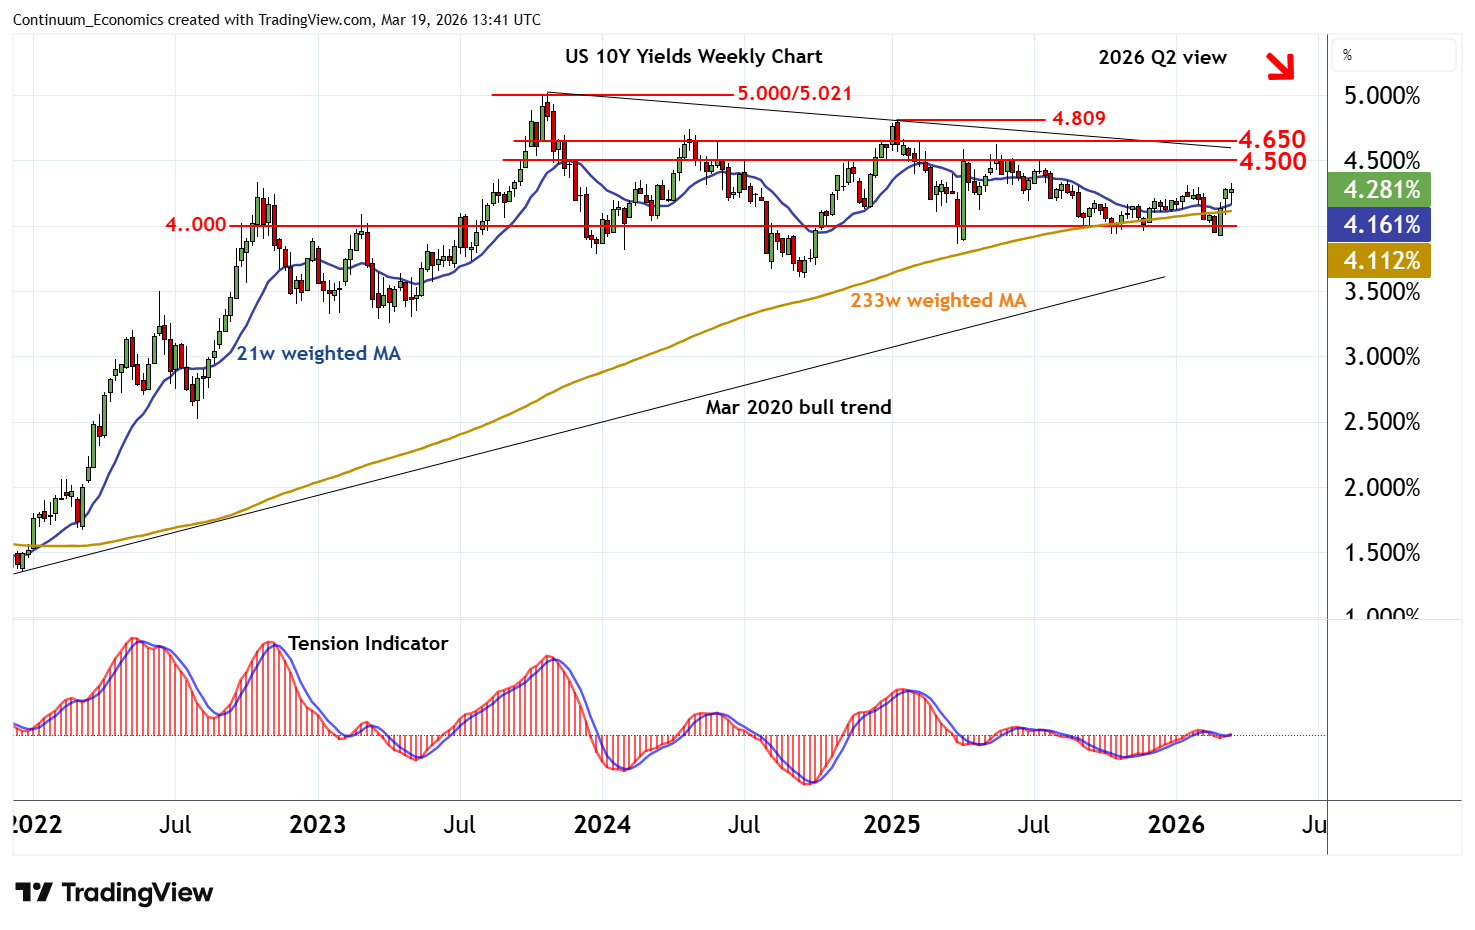
Weekly stochastics and the weekly Tension Indicator are rising, suggesting room for further gains into early 2026 Q2, with focus to turn to congestion around 4.500%.

Just higher is the 4.600% break level.

However, weekly stochastics are already trading in overbought areas, suggesting any initial tests of this range could be limited in renewed consolidation/selling pressure.

Following cautious/corrective trade, mixed/negative monthly charts and bearish longer-term readings point to fresh losses.

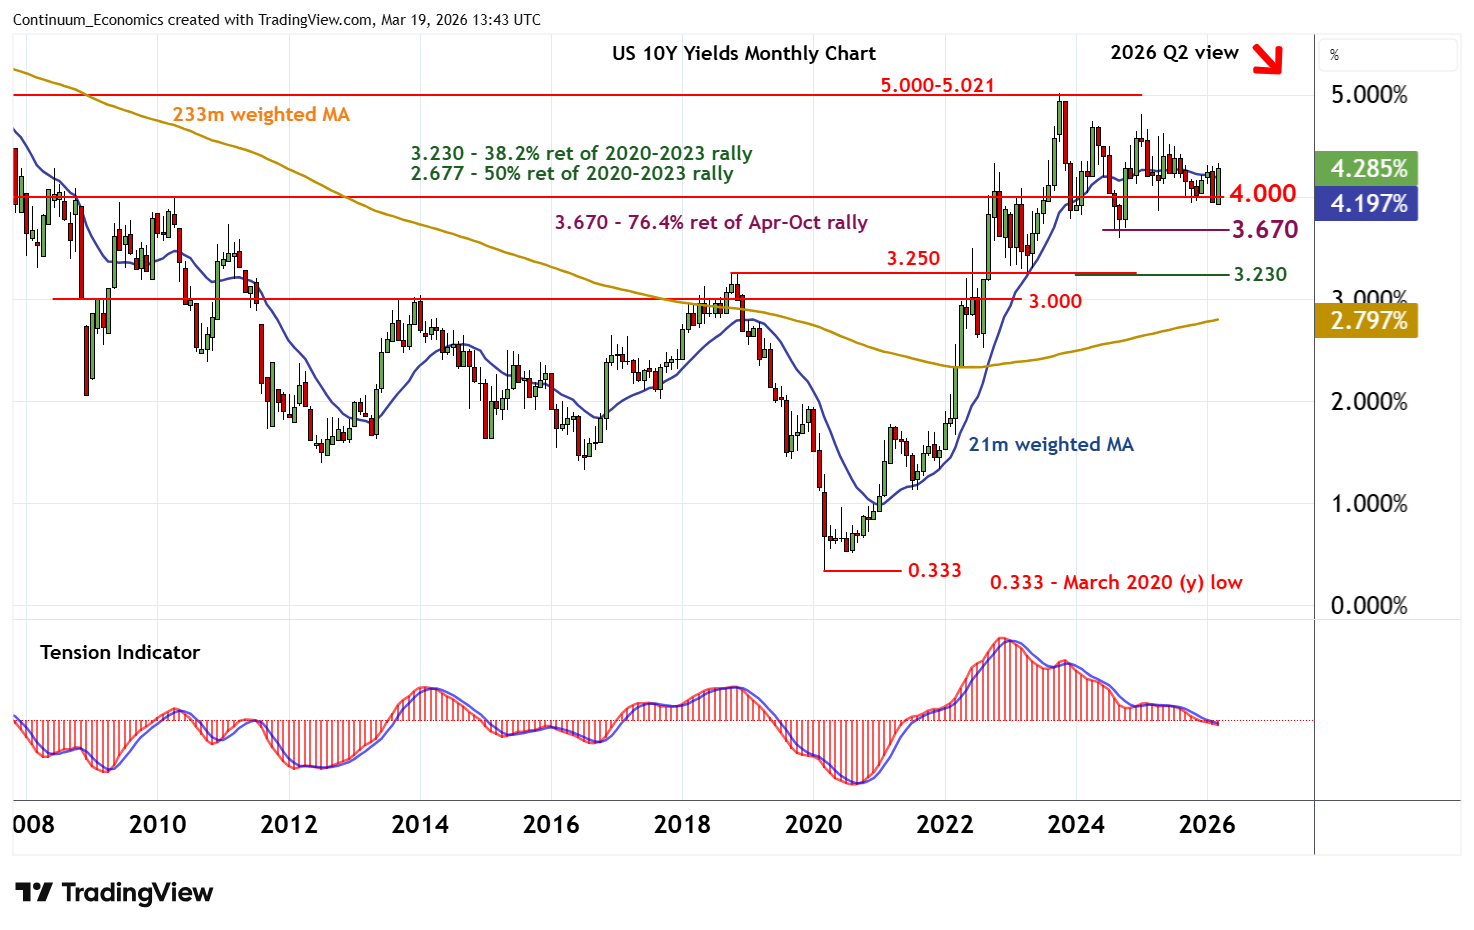
A close below 4.000% will open up critical support at the 3.670% Fibonacci retracement and the 3.599% year low of September 2024.

A further close beneath here will turn sentiment outright negative and confirm a near-term top in place at the 5.021% multi-year high of October 2023. A deeper correction of the 2020-2023 rally will then open up support at the 3.230% Fibonacci retracement and the 3.250% year high of October 2018.

Continue to read the article for free
Login

or

or

Topics
Technical Analysis
ChartBook

GENERAL

  • Home
  • About Us
  • Our Team
  • Careers

LEGAL

  • Terms and Conditions
  • Privacy Policy
  • Compliance
  • GDPR

GET IN TOUCH

  • Contact Us
Continuum Economics
The Technical Analyst Awards Winner 2021
The Technical Analyst Awards Finalist 2020

© 2026 Continuum Economics

image