Published: 2026-03-31T00:39:27.000Z
Chart NZD/USD Update: Consolidating test of .5700 Fibonacci level
1
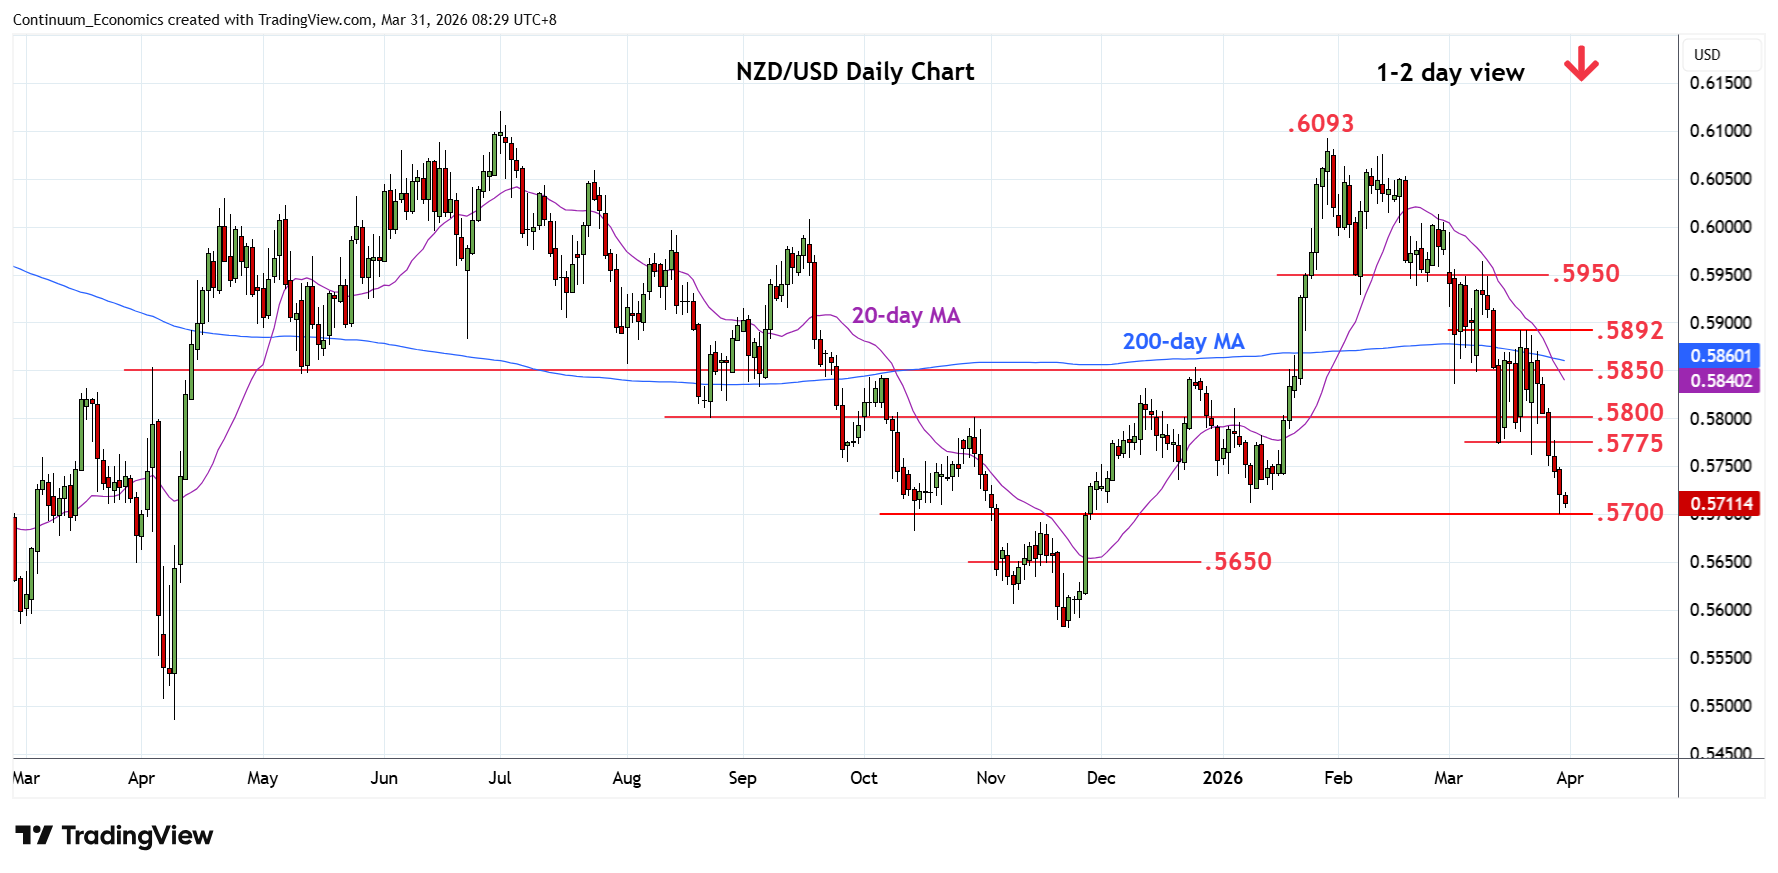
Consolidating losses to the .5700 Fibonacci level and fresh year low as prices unwind oversold intraday studies
| Levels | Imp | Comment | Levels | Imp | Comment | |||
|---|---|---|---|---|---|---|---|---|
| R4 | .5892 | ** | 19 Mar high | S1 | .5700 | * | 30 Mar YTD low, 76.4% | |
| R3 | .5850 | ** | congestion | S2 | .5650 | * | congestion | |
| R2 | .5800 | * | congestion | S3 | .5606 | * | 7 Nov low | |
| R1 | .5775 | * | 13 Mar low | S4 | .5578 | ** | 21 Nov low |
Asterisk denotes strength of level
00:30 GMT - Consolidating losses to the .5700 Fibonacci level and fresh year low as prices unwind oversold intraday studies. However, pressure remians on the downside and consolidation expected to give way to renewed selling pressure later. Lower will see room to the .5650 congestion. Break of the latter, if seen, will return focus to the .5606/.5578, November lows. Meanwhile, resistance remains at the .5775/.5800 congestion area which is expected to cap. Regaining this will ease the downside pressure and see room for stronger bounce to .5850/.5892 area.