Published: 2026-01-07T13:11:09.000Z
Chart USD/RUB Update: Pressuring resistance - background studies rising
1
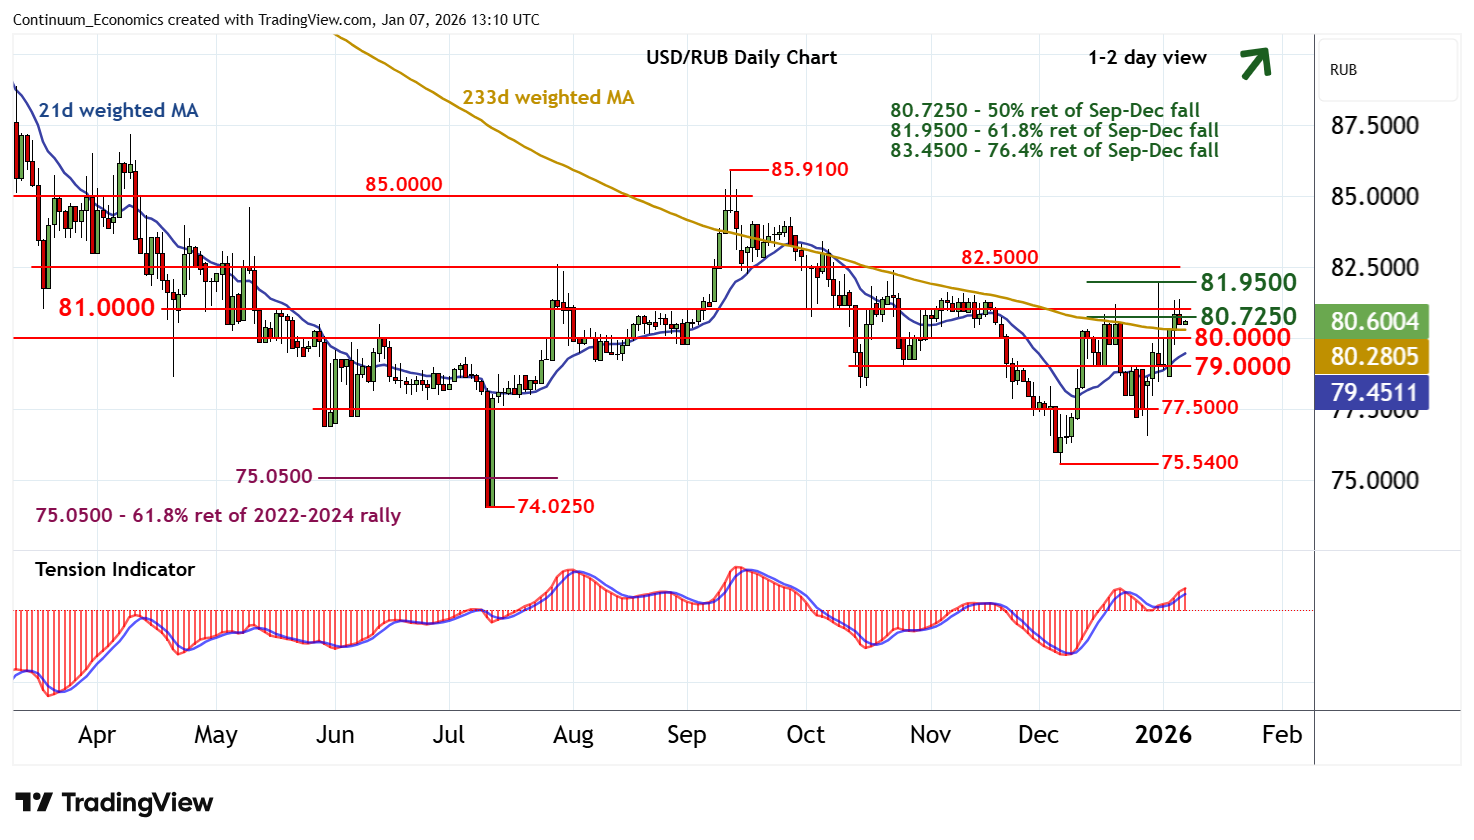
Little change, as prices extend pressure on resistance at the 80.7250 Fibonacci retracement and congestion around 81.0000
| Levels | Comment | Levels | Comment | |||||
| R4 | 82.5000 | ** | break level | S1 | 80.0000 | ** | congestion | |
| R3 | 81.9500 | ** | 61.8% ret of Sep-Dec fall | S2 | 79.0000 | * | break level | |
| R2 | 81.0000 | * | congestion | S3 | 77.5000 | * | congestion | |
| R1 | 80.7250 | * | 50% ret of Sep-Dec fall | S4 | 75.5400 | ** | 5 Dec (w) low |
Asterisk denotes strength of level
12:45 GMT - Little change, as prices extend pressure on resistance at the 80.7250 Fibonacci retracement and congestion around 81.0000. Rising daily readings highlight room for a break and continuation of December gains towards the 81.9500 retracement. But overbought daily stochastics are expected to limit any initial tests in consolidation, before improving weekly charts extend gains still further. Meanwhile, support remains at congestion around 80.0000 and extends to 79.0000. A close beneath here, if seen, will add weight to sentiment and open up a test of congestion support at 77.5000.