Published: 2026-02-17T14:51:33.000Z
Chart USD/ZAR Update: Pushing higher
5
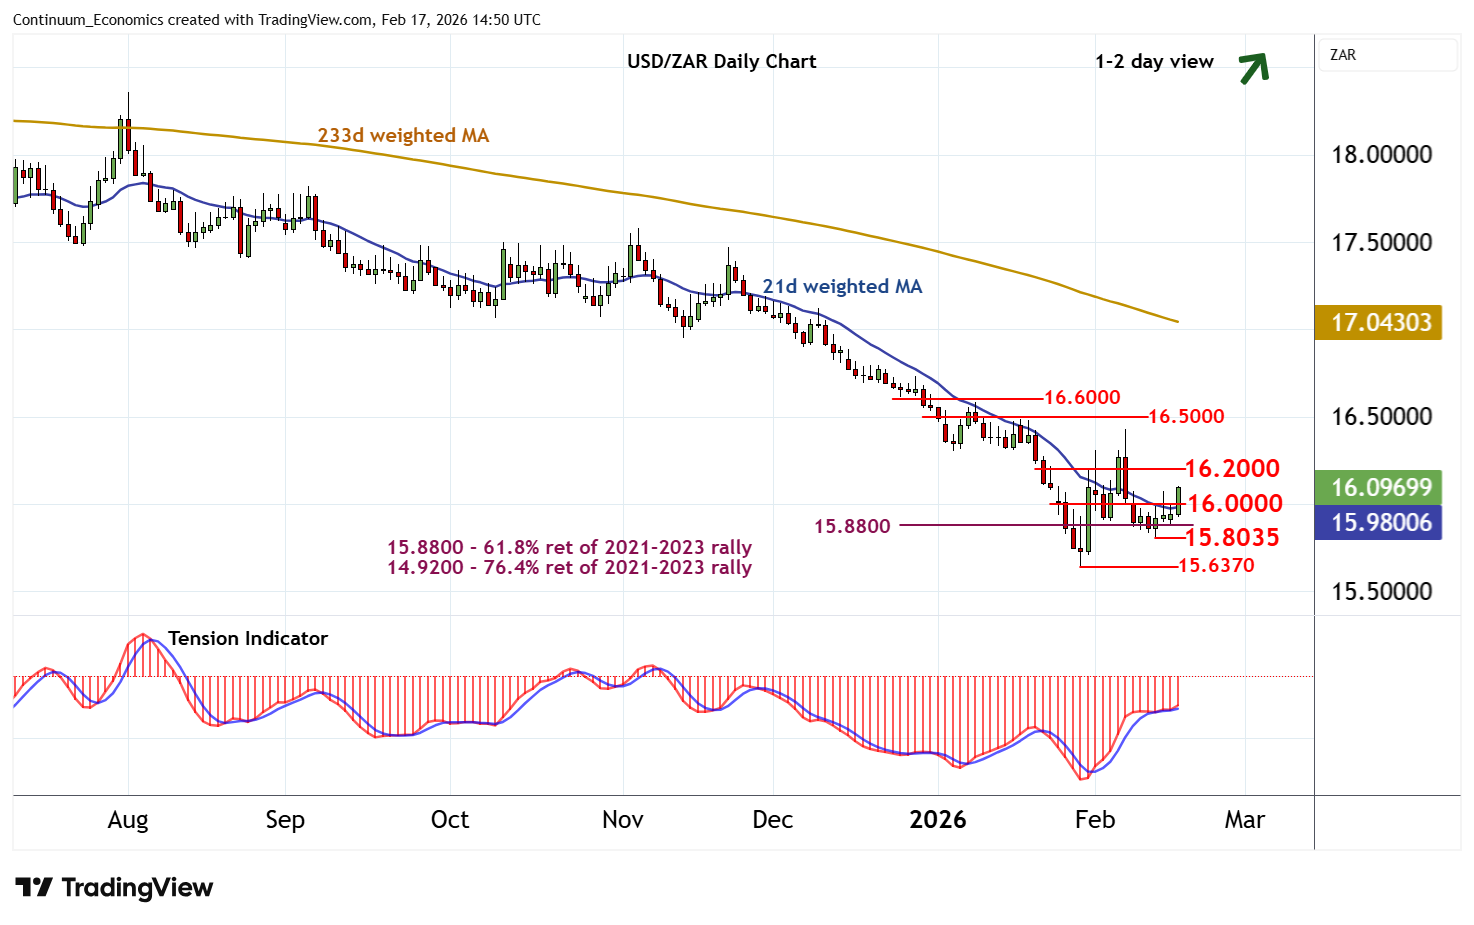
Cautious trade is giving way to a push higher
| Level | Comment | Level | Comment | |||||
|---|---|---|---|---|---|---|---|---|
| R4 | 16.6000 | break level | S1 | 16.0000 | ** | congestion | ||
| R3 | 16.5000 | break level | S2 | 15.8035 | * | 12 Feb (w) low | ||
| R2 | 16.4275 | 6 Feb (w) high | S3 | 15.6370 | ** | 29 Jan YTD low | ||
| R1 | 16.2000 | minor congestion | S4 | 15.1665 | * | June 2022 low |
Asterisk denotes strength of level
14:30 GMT - Cautious trade is giving way to a push higher, as intraday studies improve, with the break above 16.0000 putting focus on congestion around 16.2000. Daily readings have ticked higher, suggesting room for a test above here. But mixed weekly charts are expected to limit initial scope in fresh consolidation beneath 16.5000. Meanwhile, support is raised to congestion around 16.0000. However, any initial tests beneath here should give way to consolidation above the 15.0835 weekly low of 12 February.