Published: 2025-09-11T08:17:23.000Z
Chart USD Index DXY Update: Edging higher
0
-
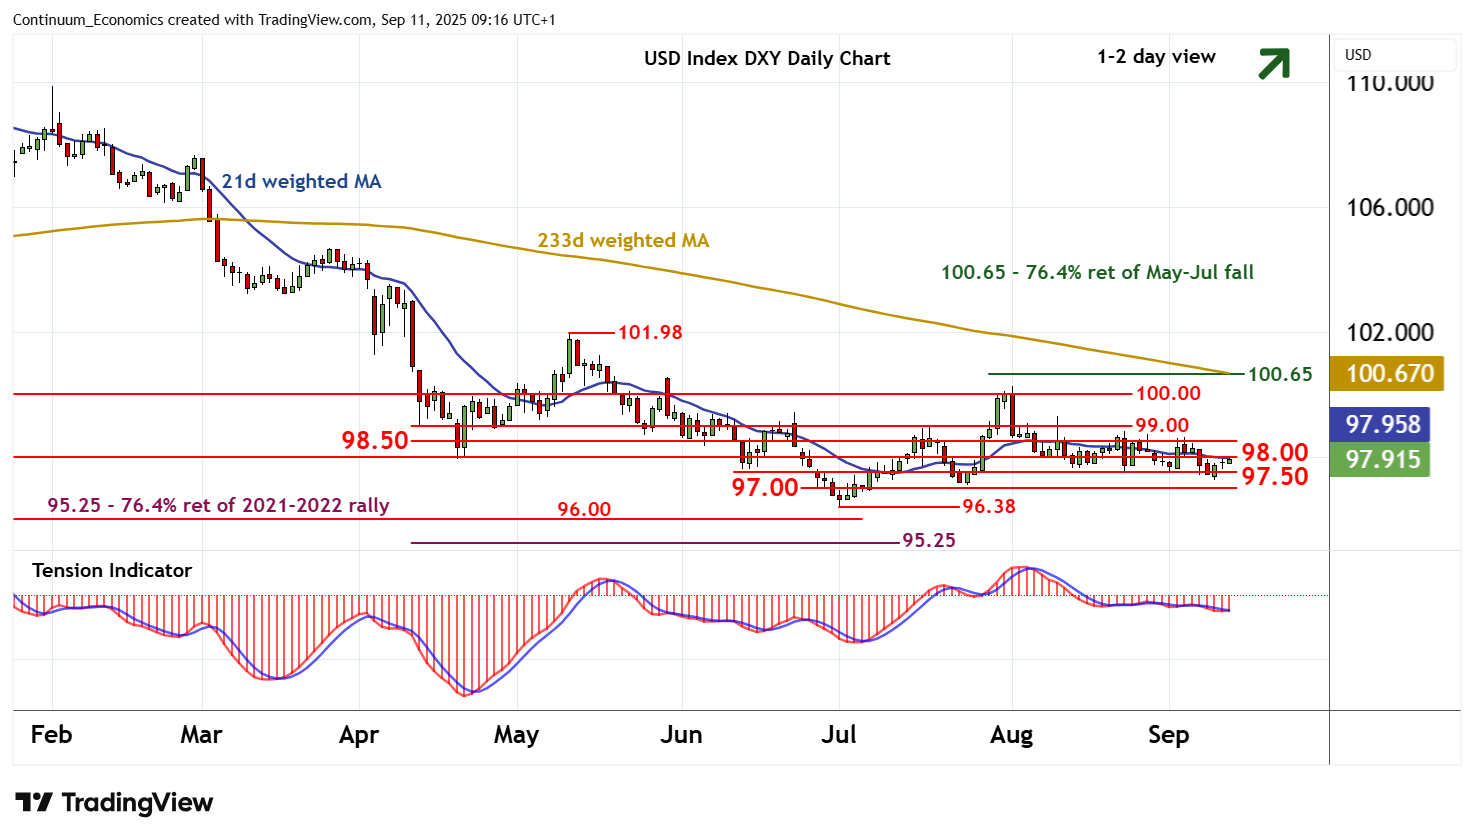
Consolidation following the bounce from the 96.25 low of 9 September is extending
| Levels | Imp | Comment | Levels | Imp | Comment | |||
|---|---|---|---|---|---|---|---|---|
| R4 | 100.00 | ** | break level | S1 | 97.50 | * | congestion | |
| R3 | 99.00 | * | break level | S2 | 97.00 | * | congestion | |
| R2 | 98.50 | congestion | S3 | 96.38 | ** | 1 Jul YTD low | ||
| R1 | 98.00 | * | congestion | S4 | 96.00 | * | historic congestion |
Asterisk denotes strength of level
09:05 BST - Consolidation following the bounce from the 96.25 low of 9 September is extending, as intraday studies continue to rise, with prices approaching congestion resistance at 98.00. Daily readings are improving, suggesting room for a test above here. But mixed weekly charts are expected to limit scope in renewed selling interest towards further congestion around 98.50. Meanwhile, support remains at 97.50 and extends to further congestion around 97.00. A break beneath here would turn sentiment negative and open up critical support at the 96.38 current year low of 1 July.