Chart USD/CAD Update: Gains to remain limited
Consolidation around 1.4000 has given way to a test higher
| Levels | Imp | Comment | Levels | Imp | Comment | |||
|---|---|---|---|---|---|---|---|---|
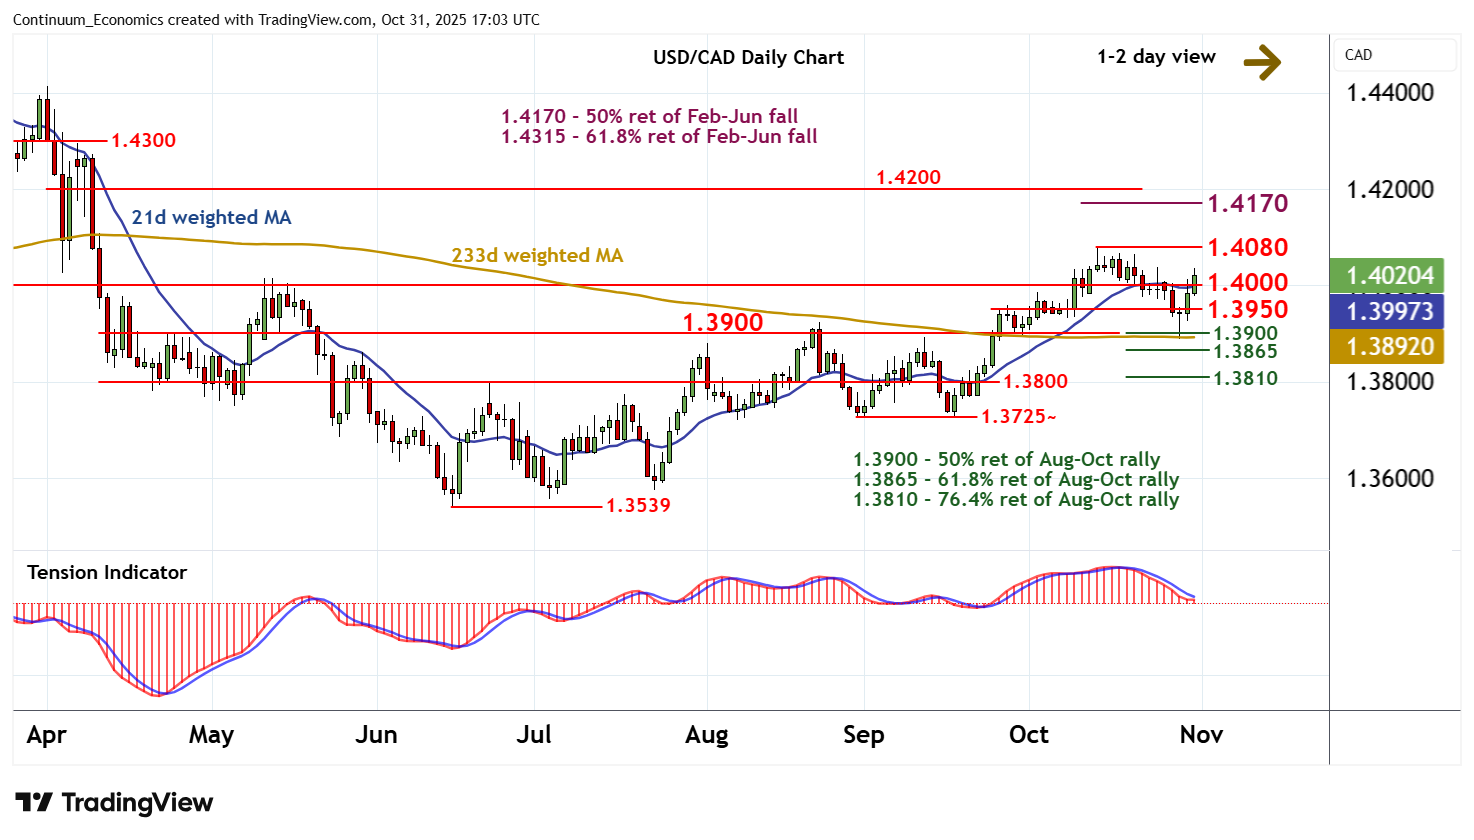
| R4 | 1.4300 | * | break level | S1 | 1.4000 | * | break level | |
| R3 | 1.4200 | * | congestion | S2 | 1.3950 | * | pivot | |
| R2 | 1.4170 | ** | 50% ret of Feb-Jun fall | S3 | 1.3900 | ** | break level, 50% ret | |
| R1 | 1.4080 | ** | 14 Oct (w) high | S4 | 1.3865 | ** | 61.8% ret of Aug-Oct rally |
Asterisk denotes strength of level
16:35 GMT - Consolidation around 1.4000 has given way to a test higher, with prices currently balanced around 1.4020. Oversold daily stochastics are unwinding and the bearish daily Tension Indicator is flattening, highlighting room for further gains in the coming sessions. However, deteriorating weekly charts should limit scope in renewed selling interest towards strong resistance at the 1.4080 weekly high of 14 October. Following cautious trade, fresh losses are looked for. Immediate support is at 1.3950. But a close below 1.3900 will add weight to sentiment and extend losses towards the 1.3865 Fibonacci retracement. Beneath here is 1.3800/10, where already oversold daily stochastics could prompt consolidation/short-covering.