Published: 2026-04-13T00:26:50.000Z
Chart AUD/USD Update: Gapped down to retest .7000
-
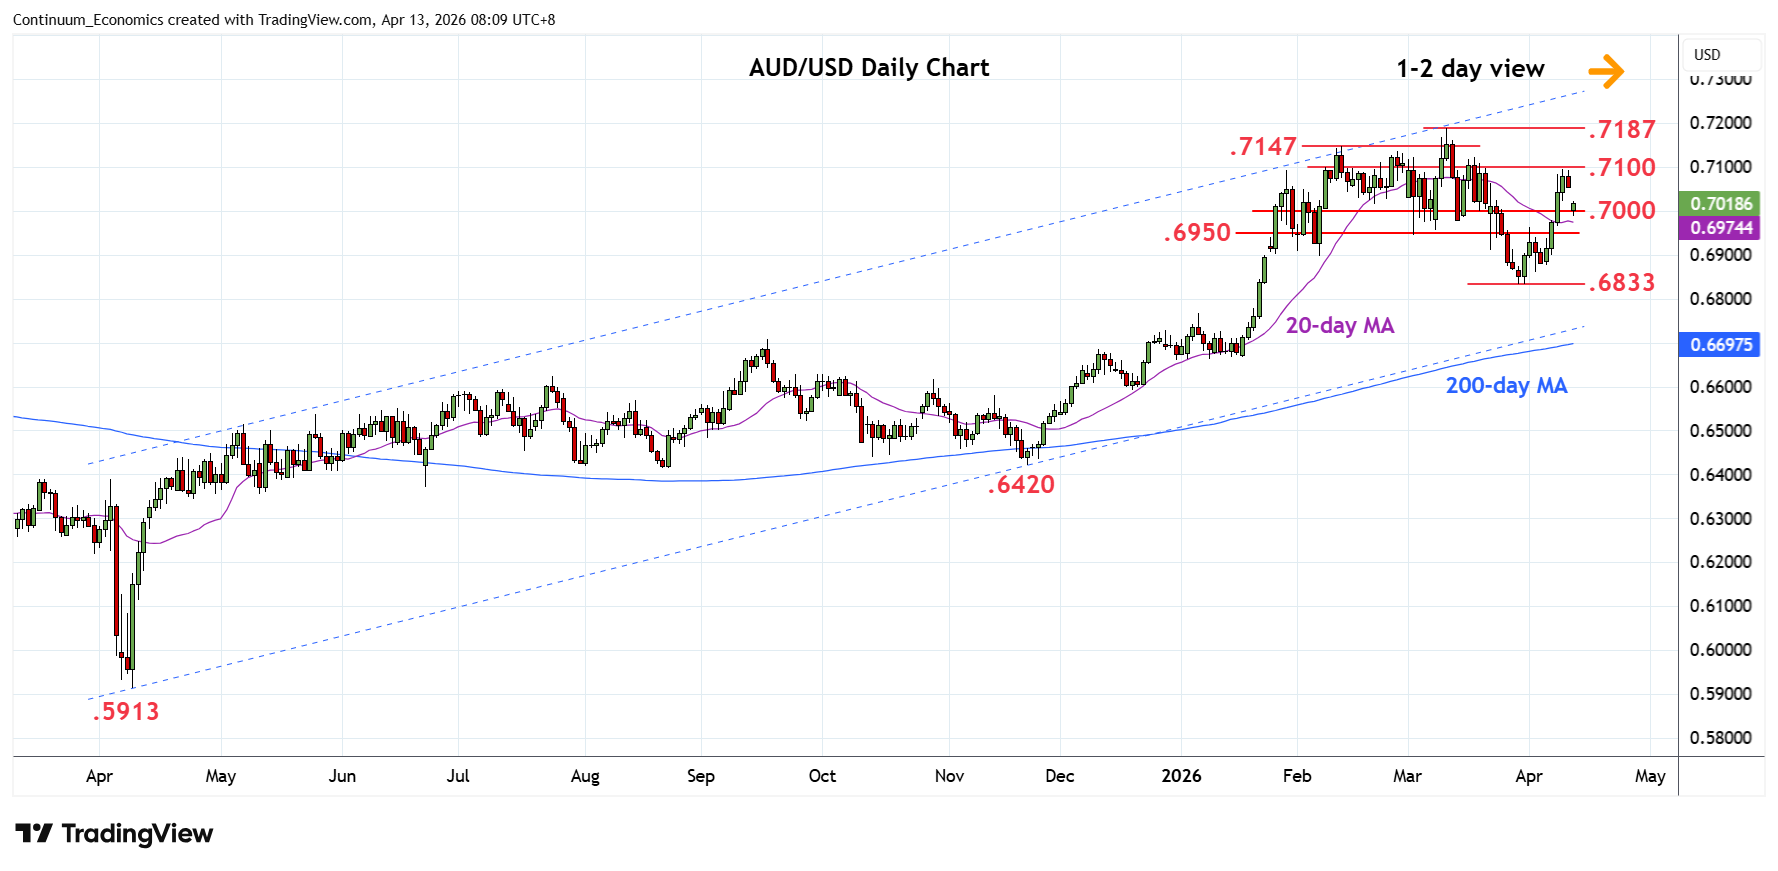
Gapped down at the open see prices back to retest the .7000 figure as intraday studies unwind overbought readings
| Levels | Imp | Comment | Levels | Imp | Comment | |||
|---|---|---|---|---|---|---|---|---|
| R4 | 0.7187 | ** | 11 Mar YTD high | S1 | 0.7000 | * | figure, congestion | |
| R3 | 0.7147 | * | Feb high | S2 | 0.6950 | * | congestion | |
| R2 | 0.7100 | ** | congestion | S3 | 0.6900 | ** | congestion | |
| R1 | 0.7052 | * | 10 Apr low, gap | S4 | 0.6833 | ** | 30 Mar low |
Asterisk denotes strength of level
00:15 GMT - Gapped down at the open see prices back to retest the .7000 figure as intraday studies unwind overbought readings. Break here will see room for deeper pullback to strong support at the .6950 congestion. Failure to hold this will return focus to the downside and see see scope for pullback to retest the .6900 level and .6833 March swing low. Meanwhile, resistance is lowered to the Friday's low and gap area at .7052 and extending to the .7100 congestion. This area now expected to cap and keep pressure on the downside.