Published: 2026-01-14T14:16:38.000Z
Chart USD/JPY Update: Sharp pullback from fresh multi-year high
2
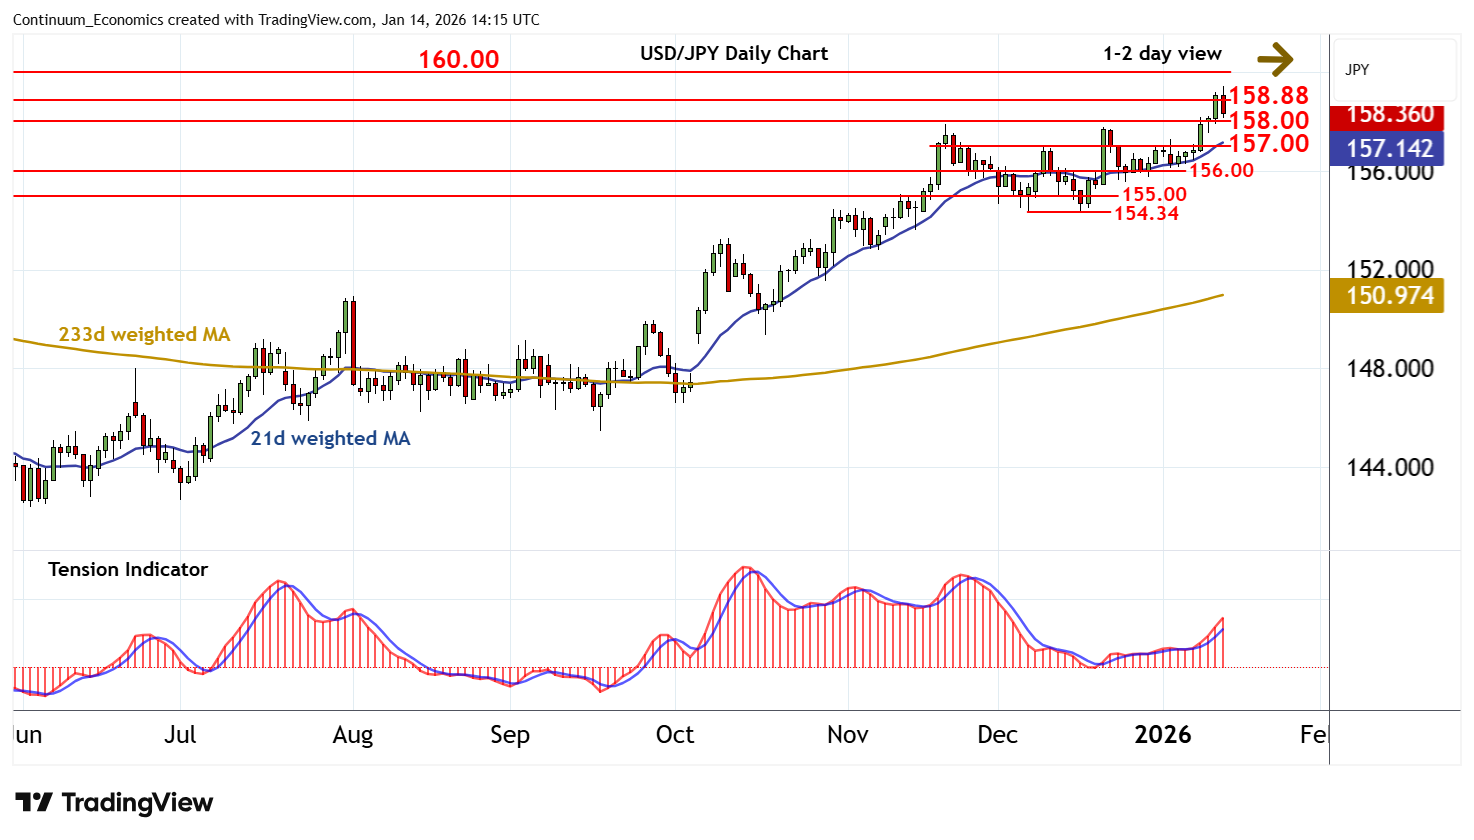
The break above the 158.88 year high of 10 January 2025 has been pushed back sharply from 159.45
| Levels | Imp | Comment | Levels | Imp | Comment | |||
|---|---|---|---|---|---|---|---|---|
| R4 | 161.95 | ** | July 2024 (y) high | S1 | 158.00 | * | break level | |
| R3 | 160.00 | ** | congestion | S2 | 157.00 | congestion | ||
| R2 | 159.45 | current YTD high | S3 | 156.00 | * | congestion | ||
| R1 | 158.88 | ** | 10 January 2025 (y) high | S4 | 155.00 | * | break level |
Asterisk denotes strength of level
14:05 GMT - The break above the 158.88 year high of 10 January 2025 has been pushed back sharply from 159.45, as overbought intraday studies unwind, with prices currently trading around 158.25. Overbought daily stochastics are ticking lower, suggesting room for a test below support at 158.00. But the positive daily Tension Indicator and improving weekly charts are expected to limit scope in renewed buying interest/consolidation towards 157.00. Meanwhile, a close back above 158.88 would improve sentiment and extend April 2025 gains initially towards congestion around 160.00.