Published: 2025-07-23T15:51:05.000Z
Chart USD/CAD Update: Limited downside tests

Senior Technical Strategist
2
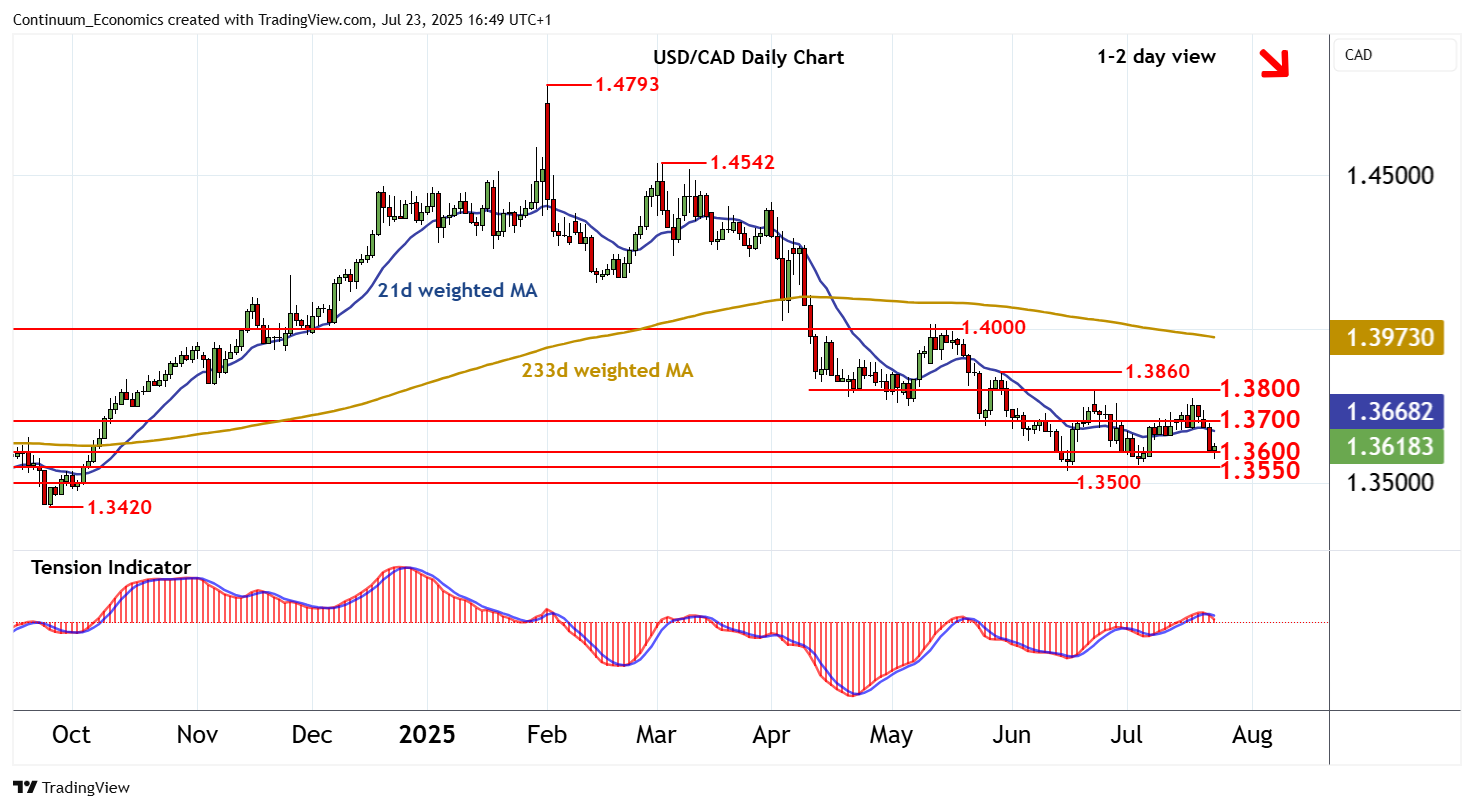
The anticipated break below 1.3600 has bounced from 1.3575
| Levels | Imp | Comment | Levels | Imp | Comment | |||
|---|---|---|---|---|---|---|---|---|
| R4 | 1.3900 | * | break level | S1 | 1.3600 | ** | congestion | |
| R3 | 1.3860 | * | 29 May (w) high | S2 | 1.3550 | * | congestion | |
| R2 | 1.3800 | * | congestion | S3 | 1.3500 | * | congestion | |
| R1 | 1.3700 | ** | congestion | S4 | 1.3420 | ** | 25 Sep (m) low |
Asterisk denotes strength of level
16:30 BST - The anticipated break below 1.3600 has bounced from 1.3575, as oversold intraday studies unwind, with prices once again trading above 1.3600. Daily stochastics and the daily Tension Indicator continue to track lower, highlighting room for a retest beneath here. But positive weekly charts are expected to limit immediate downside scope in renewed buying interest/consolidation towards further congestion around 1.3550. Meanwhile, resistance remains at congestion around 1.3700. A close back above here would help to stabilise price action and prompt consolidation beneath congestion around 1.3800.