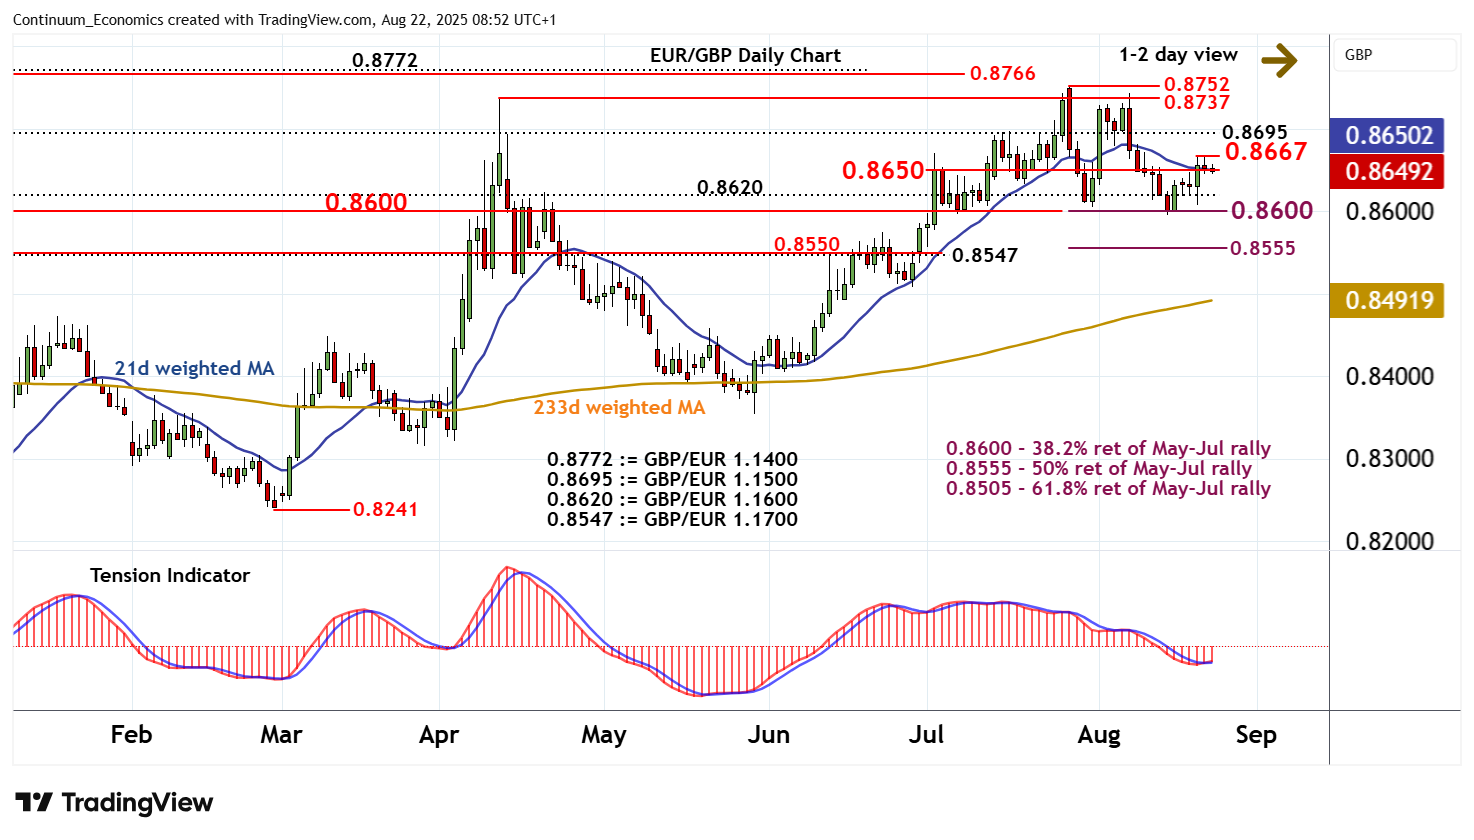
Chart EUR/GBP Update: Leaning lower
The recent break above 0.8650 has met selling interest at 0.8667
| Level | Comment | Level | Comment | |||||
|---|---|---|---|---|---|---|---|---|
| R4 | 0.8752 | ** | 28 Jul YTD high | S1 | 0.8650 | ** | congestion | |
| R3 | 0.8737 | ** | 11 Apr (m) high | S2 | 0.8620 | * | GBP/EUR 1.1600 | |
| R2 | 0.8695 | ** | GBP/EUR 1.1500 | S3 | 0.8600 | ** | cong, 38.2% ret | |
| R1 | 0.8667 | 20 Aug high | S4 | 0.8555 | ** | 50% ret of May-Jul rally |
Asterisk denotes strength of level
08:40 BST - The recent break above 0.8650 has met selling interest at 0.8667, with prices currently pressuring congestion support at 0.8650 in cautious trade. Intraday studies have turned down, highlighting room for a test beneath here. Focus will then turn to support at 0.8600/20, where rising daily readings are expected to prompt fresh reactions. However, broader weekly charts are bearish, pointing to room for a later break and confirmation a near-term top in place at the 0.8752 current year high of 28 July. Support at the 0.8555 Fibonacci retracement should then attract. Meanwhile, a break above the 0.8667 high of 20 August, if seen, will open up 0.8695, (GBP/EUR 1.1500), where fresh selling interest is expected to appear.