Published: 2025-02-19T08:29:37.000Z
Chart GBP/USD Update: Balanced trade - background studies rising

Senior Technical Strategist
1
Still little change, as mixed intraday studies and overbought flat daily stochastics keep near-term sentiment cautious
| Level | Comment | Level | Comment | |||||
|---|---|---|---|---|---|---|---|---|
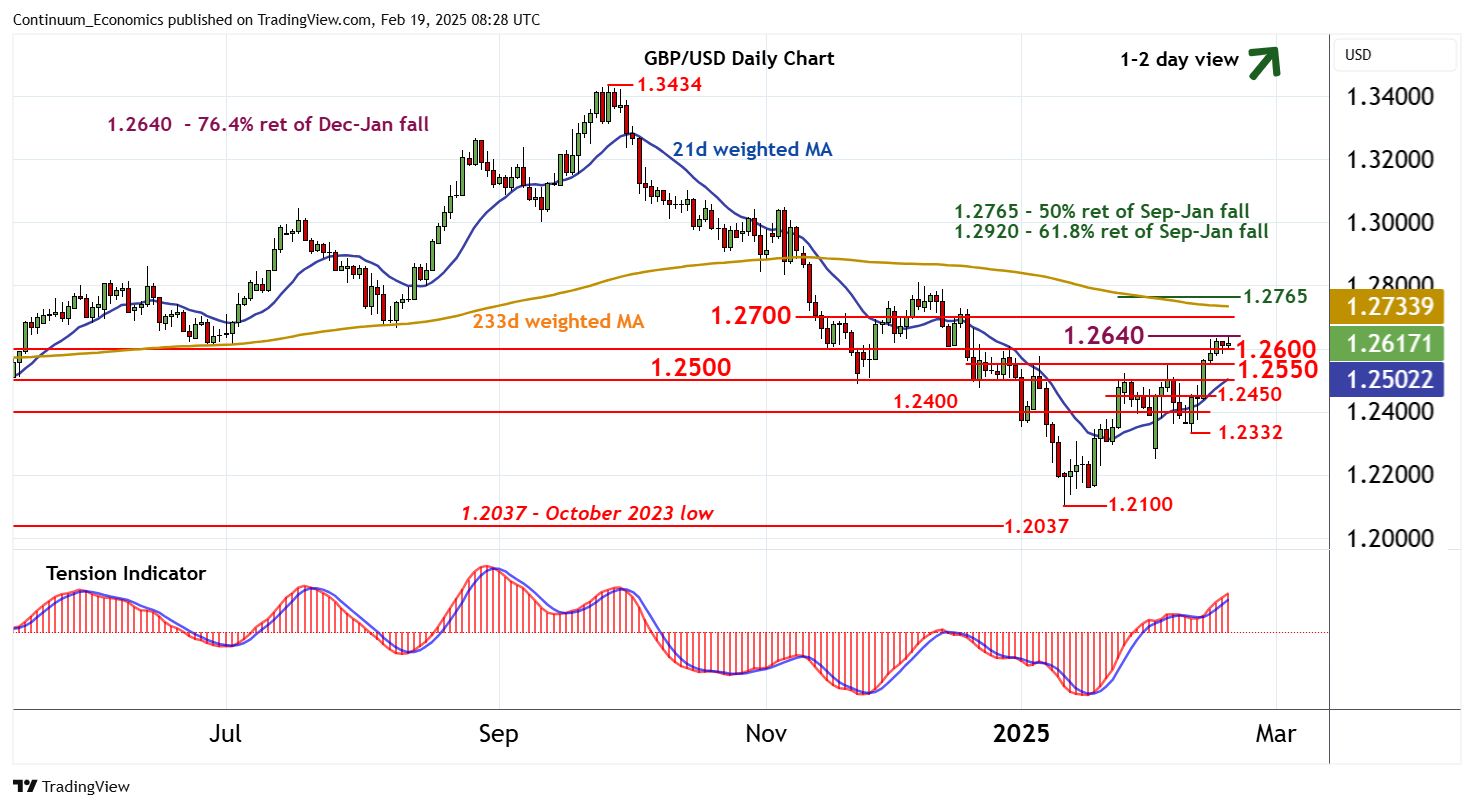
| R4 | 1.2765 | ** | 50% ret of Sep-Jan fall | S1 | 1.2550 | * | break level | |
| R3 | 1.2700 | * | congestion | S2 | 1.2500 | * | break level | |
| R2 | 1.2640 | ** | 76.4% ret of Dec-Jan fall | S3 | 1.2450 | break level | ||
| R1 | 1.2600 | * | congestion | S4 | 1.2400 | * | congestion |
Asterisk denotes strength of level
08:10 GMT - Still little change, as mixed intraday studies and overbought flat daily stochastics keep near-term sentiment cautious and extend consolidation within resistance at congestion around 1.2600 and the 1.2640 Fibonacci retracement. The daily Tension Indicator continues to rise, however, and broader weekly charts are positive, highlighting room for further gains in the coming sessions. A close above 1.2640 will turn sentiment positive and extend January gains towards congestion around 1.2700. Meanwhile, any fresh tests below 1.2600 should meet renewed buying interest above 1.2550.