Published: 2026-04-16T12:11:41.000Z
Chart USD/ZAR Update: Cautious trade - studies under pressure
2
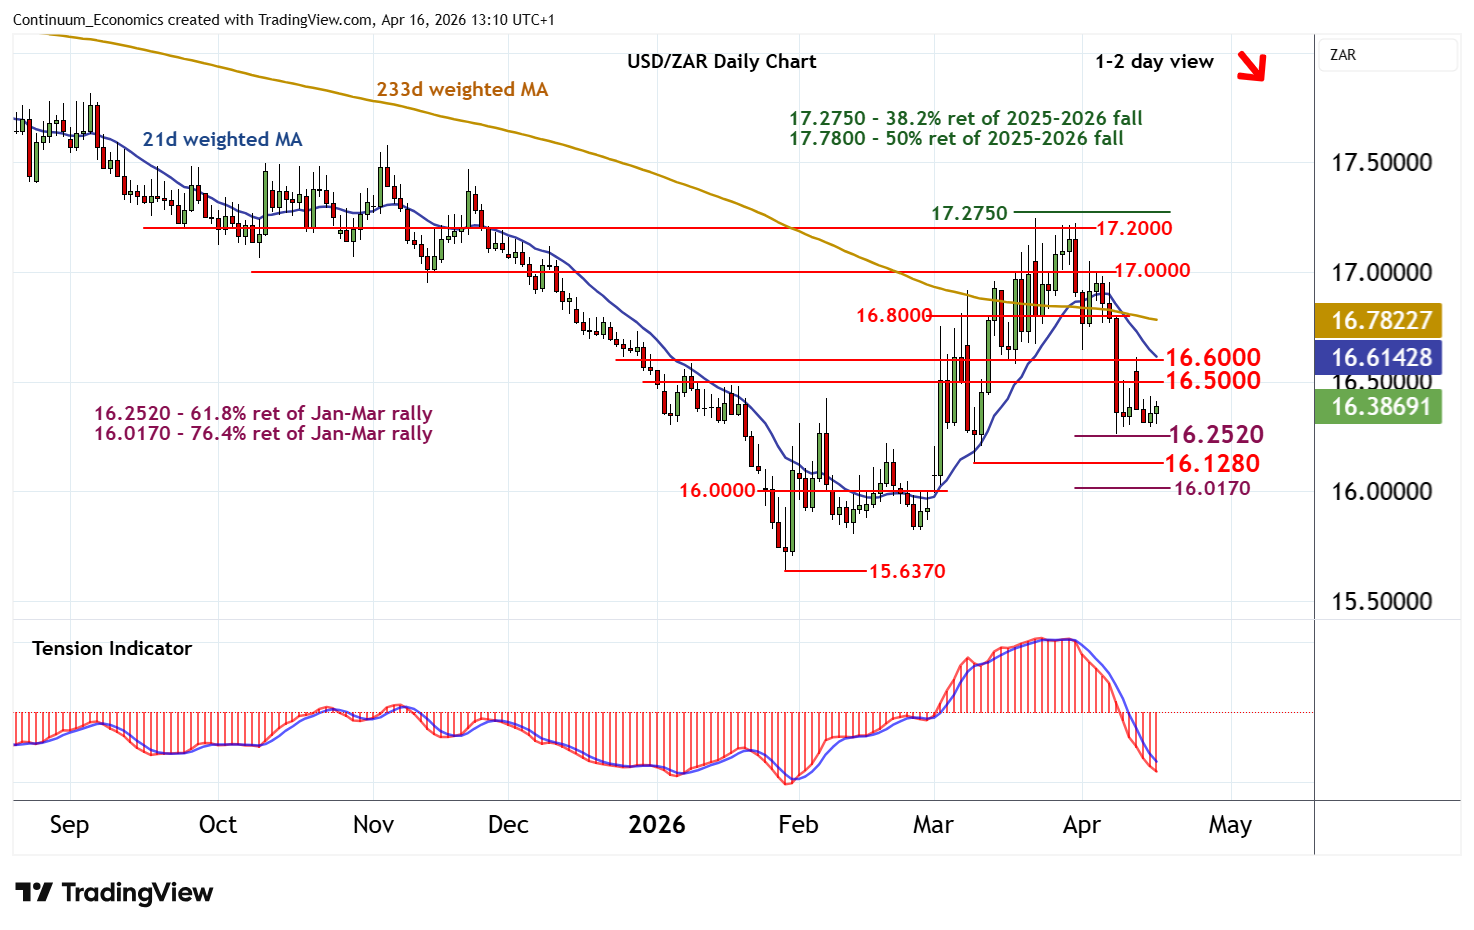
Little change, as oversold daily stochastics edge higher and prompt further consolidation beneath 16.4000
| Level | Comment | Level | Comment | |||||
|---|---|---|---|---|---|---|---|---|
| R4 | 17.0000 | * | congestion | S1 | 16.2520 | ** | 61.8% ret of Jan-Mar rally | |
| R3 | 16.8000 | * | congestion | S2 | 16.1280 | * | 10 Mar (w) low | |
| R2 | 16.6000 | break level | S3 | 16.0170 | ** | 76.4% ret of Jan-Mar rally | ||
| R1 | 16.5000 | break level | S4 | 16.0000 | ** | congestion |
Asterisk denotes strength of level
12:50 BST - Little change, as oversold daily stochastics edge higher and prompt further consolidation beneath 16.4000. The daily Tension Indicator remains negative and broader weekly charts are negative, highlighting room for further losses in the coming sessions. Support remains at the 16.2520 Fibonacci retracement. A close beneath here will add weight to sentiment and extend late-March losses towards the 16.1280 weekly low of 10 March. Meanwhile, resistance is at 16.5000 and extends to 16.6000. This range should cap any immediate tests higher.