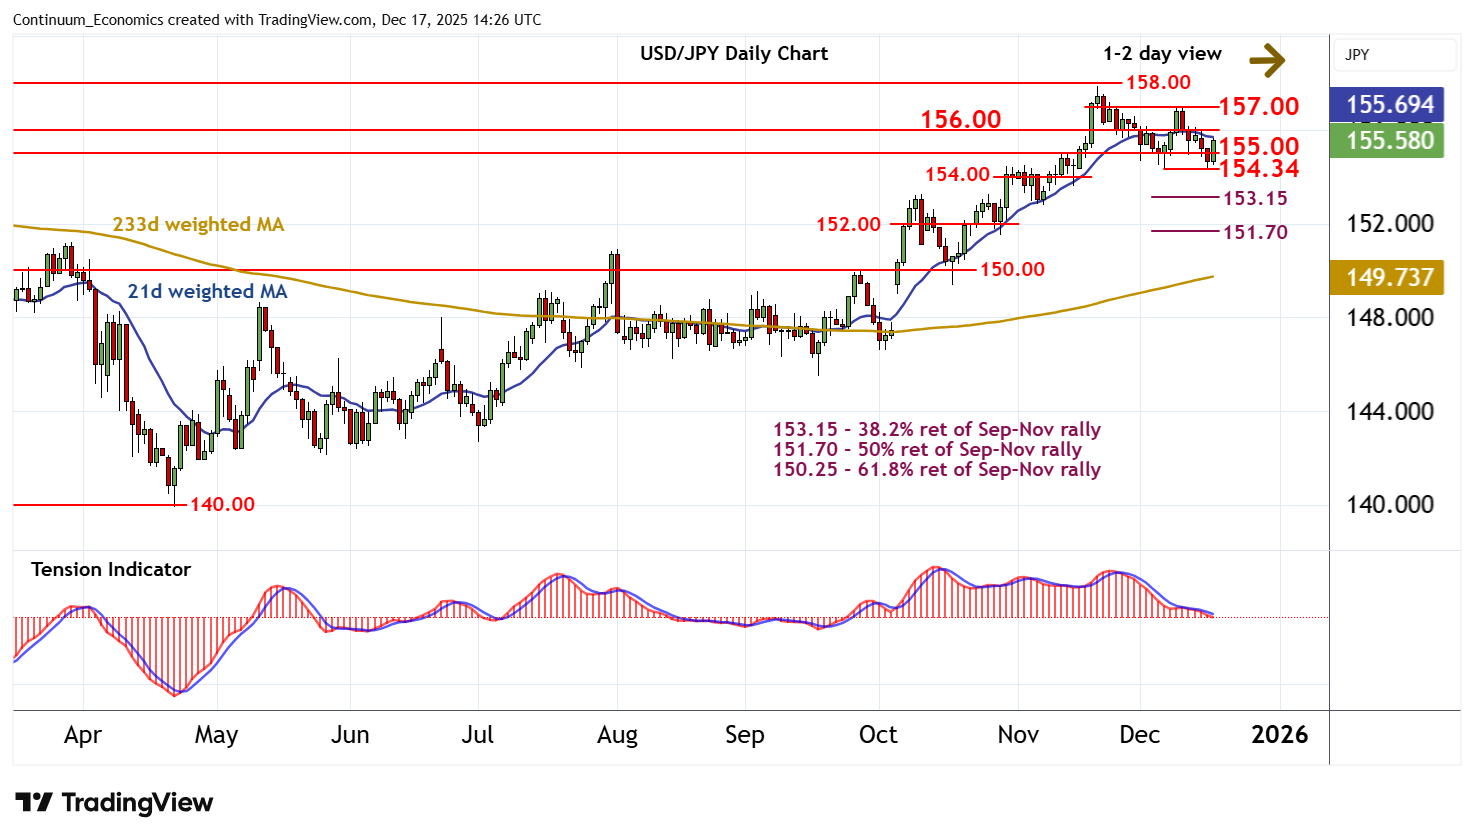
Chart USD/JPY Update: Gains to remain limited
Cautious trade around strong support at the 154.34 weekly low of 5 December has given way to a bounce
| Levels | Imp | Comment | Levels | Imp | Comment | |||
|---|---|---|---|---|---|---|---|---|
| R4 | 160.00 | ** | figure | S1 | 155.00 | * | break level | |
| R3 | 157.90/00 | * | 20 Nov (m) high; break level | S2 | 154.34 | * | 5 Dec (w) low | |
| R2 | 157.00 | minor congestion | S3 | 154.00 | * | break level | ||
| R1 | 156.00 | * | congestion | S4 | 153.15 | ** | 38.2% ret of Sep-Nov rally |
Asterisk denotes strength of level
14:10 GMT - Cautious trade around strong support at the 154.34 weekly low of 5 December has given way to a bounce, as oversold intraday studies unwind, with prices currently trading around 155.50. A tick higher in oversold daily stochastics highlights potential for a test of congestion resistance at 156.00. But the bearish daily Tension Indicator and deteriorating weekly charts are expected to limit any break in renewed selling interest beneath congestion around 157.00. Following corrective trade, fresh losses are looked for. Immediate support is at the 155.00 break level. But a close below 154.34 is needed to turn sentiment negative and confirm continuation of late-November losses, as 154.00 then attracts, ahead of the 153.15 Fibonacci retracement.