Published: 2025-09-09T14:10:47.000Z
Chart AUD/USD Update: Limited downside tests
0
4
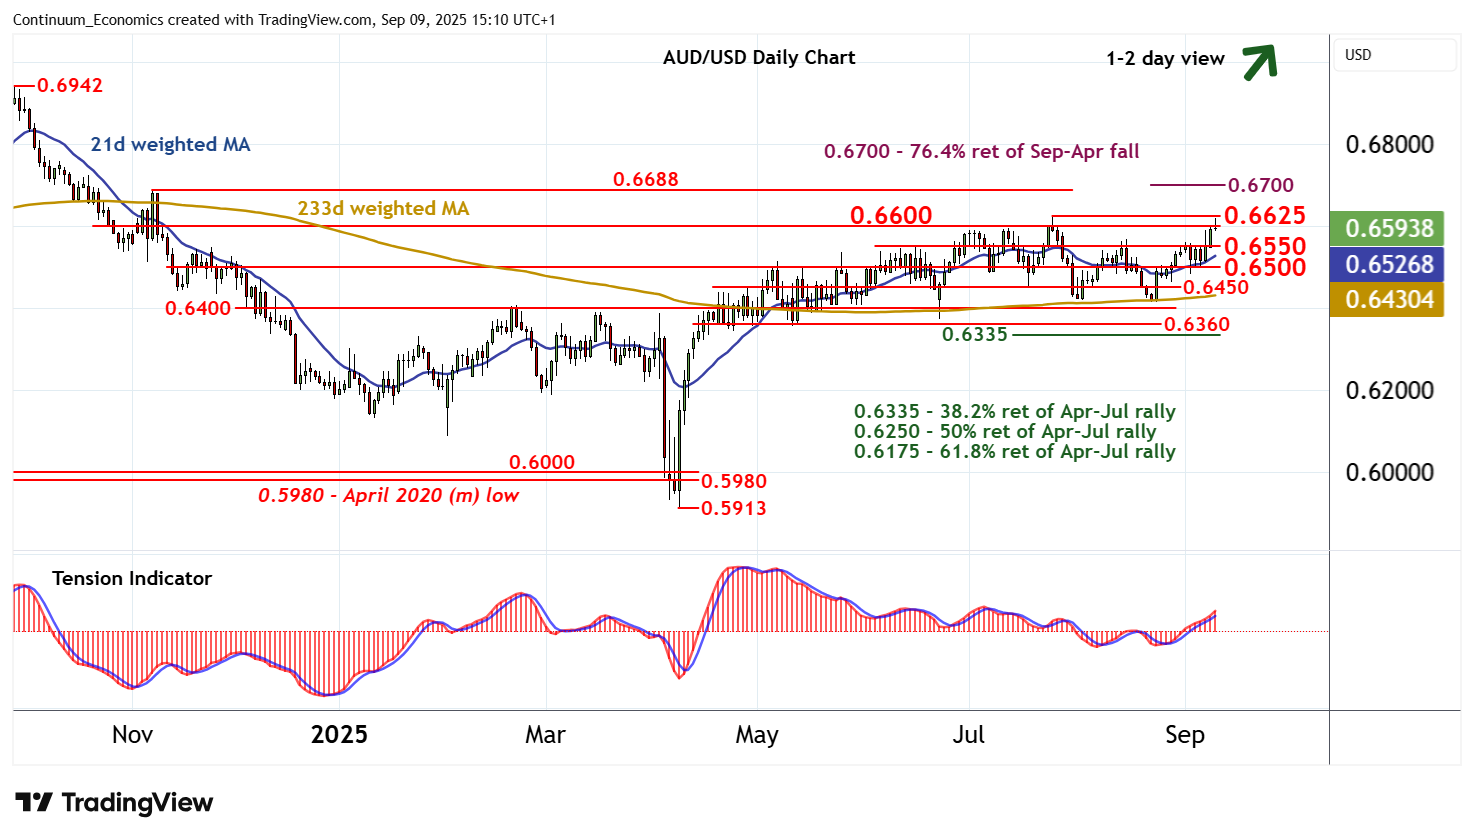
The anticipated test of resistance at congestion around 0.6600 and the 0.6625 current year high of 24 July is giving way to a pullback
| Levels | Imp | Comment | Levels | Imp | Comment | |||
|---|---|---|---|---|---|---|---|---|
| R4 | 0.6700 | ** | 76.4% ret of Sep-Apr fall | S1 | 0.6550 | * | congestion | |
| R3 | 0.6688 | ** | 7 Nov (m) high | S2 | 0.6500 | * | congestion | |
| R2 | 0.6625 | ** | 24 Jul YTD high | S3 | 0.6450 | congestion | ||
| R1 | 0.6600 | ** | congestion | S4 | 0.6400 | * | break level |
Asterisk denotes strength of level
14:55 BST - The anticipated test of resistance at congestion around 0.6600 and the 0.6625 current year high of 24 July is giving way to a pullback, as intraday studies turn down, with prices currently trading around 0.6590. Focus is turning to congestion support at 0.6550. But rising daily and weekly charts are expected to limit any tests in renewed buying interest. Following corrective trade, fresh gains are looked for. However, a close above 0.6600/25 is needed to turn sentiment outright positive and confirm continuation of April gains.