Published: 2026-03-04T02:07:36.000Z
Chart GBP/USD Update: Consolidating, room for lower later
2
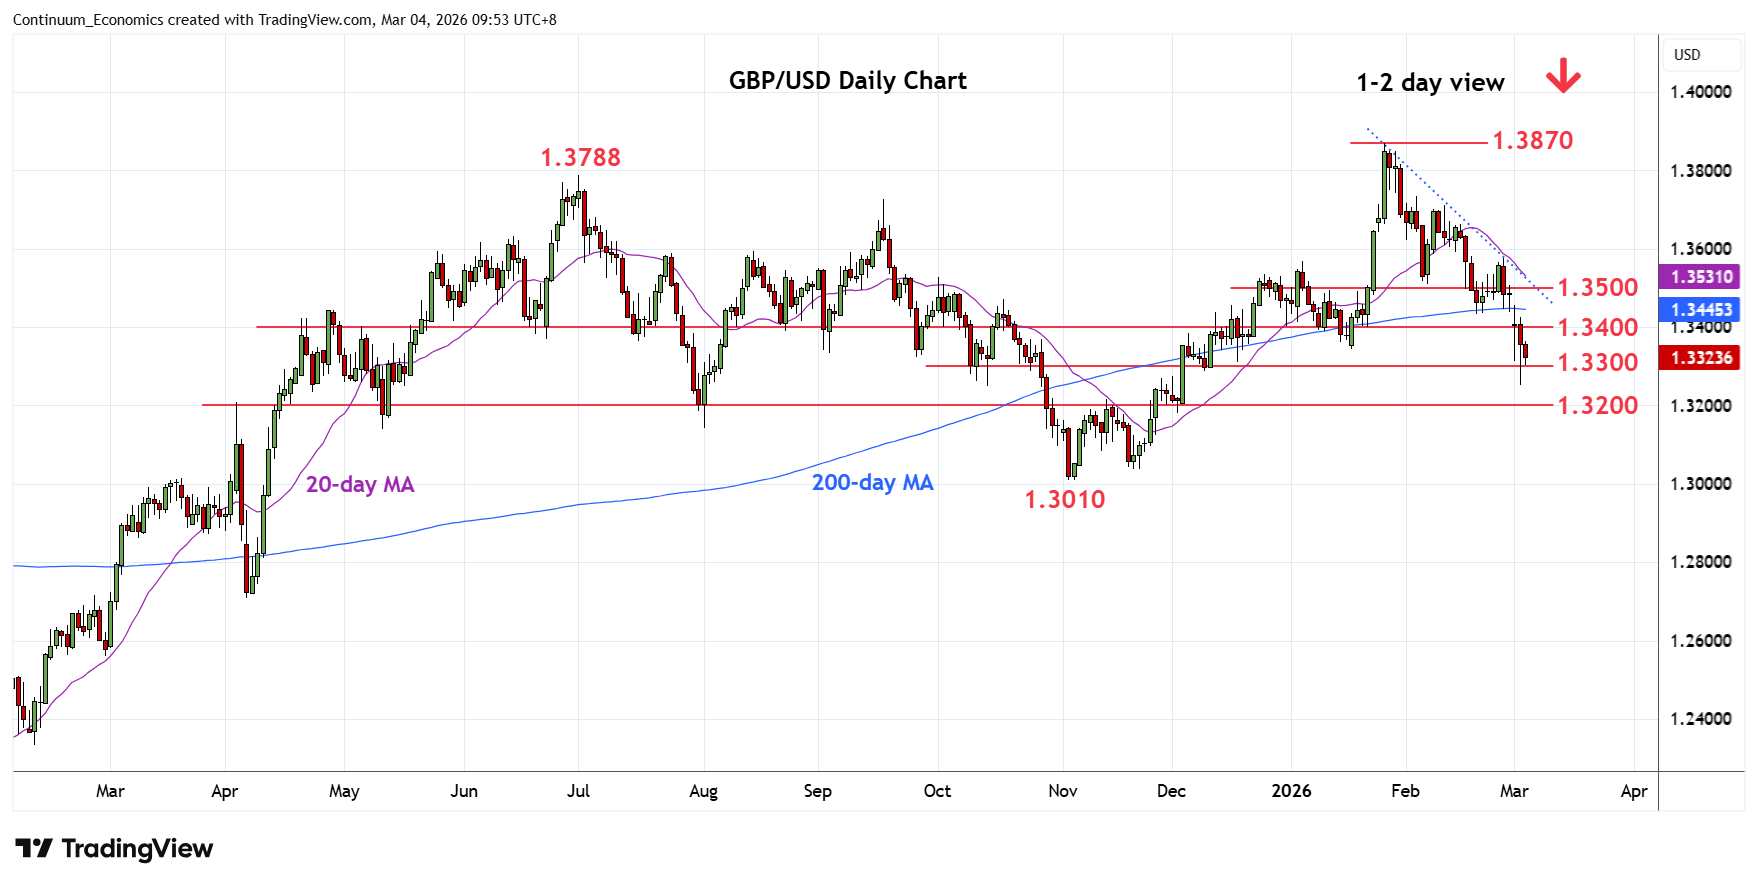
Break of the 1.3300 level saw spike to 1.3253 low before turning up to consolidate sharp losses this week
| Level | Comment | Level | Comment | |||||
|---|---|---|---|---|---|---|---|---|
| R4 | 1.3575 | ** | 26 Feb high | S1 | 1.3300 | * | congestion | |
| R3 | 1.3500/10 | ** | congestion, 6 Feb low | S2 | 1.3250 | * | congestion | |
| R2 | 1.3435 | * | 19 Feb low | S3 | 1.3215 | * | 76.4% Nov/Jan rally | |
| R1 | 1.3400 | * | congestion | S4 | 1.3200 | * | congestion |
Asterisk denotes strength of level
02:00 GMT - Break of the 1.3300 level saw spike to 1.3253 low before turning up to consolidate sharp losses this week following Monday's break of the 1.3435 support. However, negative daily and weekly studies keeps pressure on the downside and break of the 1.3300 congestion and 1.3253 low will see room to 1.3215, 76.4% Fibonacci retracement, and the 1.3200 congestion. Meanwhile, resistance is lowered to the 1.3400/35 congestion and the 19 February low. This area now expected to cap and sustain losses from the 1.3870, January current year high.