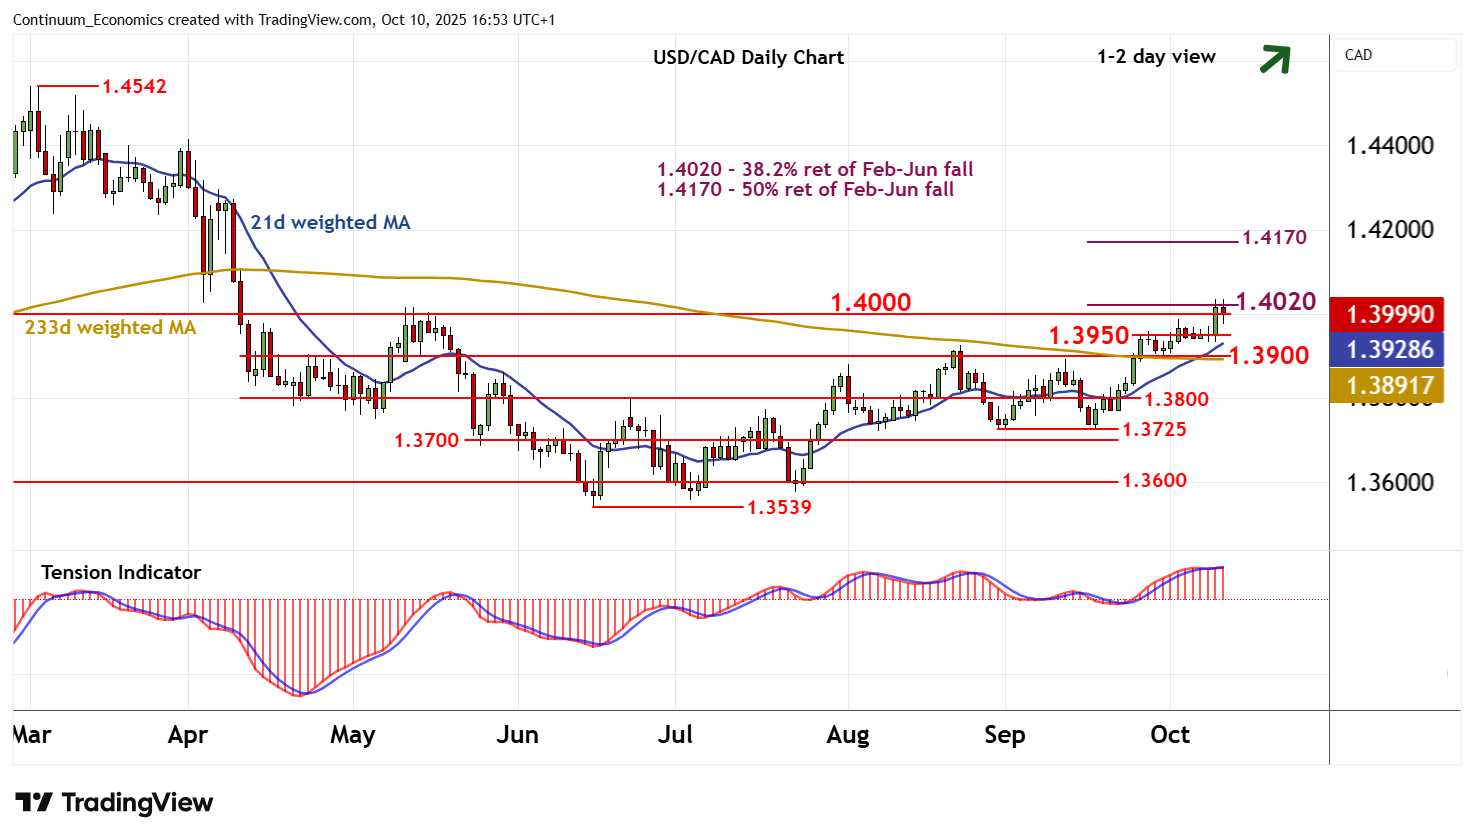
Chart USD/CAD Update: Consolidating test of 1.4000/20 - background studies rising
The anticipated test of strong resistance at 1.4000/20 is giving way to a minor pullback
| Levels | Imp | Comment | Levels | Imp | Comment | |||
|---|---|---|---|---|---|---|---|---|
| R4 | 1.4300 | * | congestion | S1 | 1.3950 | * | pivot | |
| R3 | 1.4200 | ** | break level | S2 | 1.3900 | ** | break level | |
| R2 | 1.4170 | ** | 50% ret of Feb-Jun fall | S3 | 1.3800 | * | congestion | |
| R1 | 1.4000/20 | ** | break level; 38.2% ret | S4 | 1.3725 | * | 29 Aug (w) low |
Asterisk denotes strength of level
16:40 BST - The anticipated test of strong resistance at 1.4000/20 is giving way to a minor pullback, as intraday studies turn down and overbought daily stochastics flatten, with prices currently balanced around 1.3995. Further losses are highlighted towards 1.3950. But the rising daily Tension Indicator and positive weekly charts are expected to limit any deeper losses in renewed buying interest above 1.3900. Meanwhile, a close above 1.4000/20 will improve sentiment and confirm continuation of June gains. Focus will then turn to the 1.4170 Fibonacci retracement, where already overbought daily stochastics could prompt renewed selling interest/consolidation.