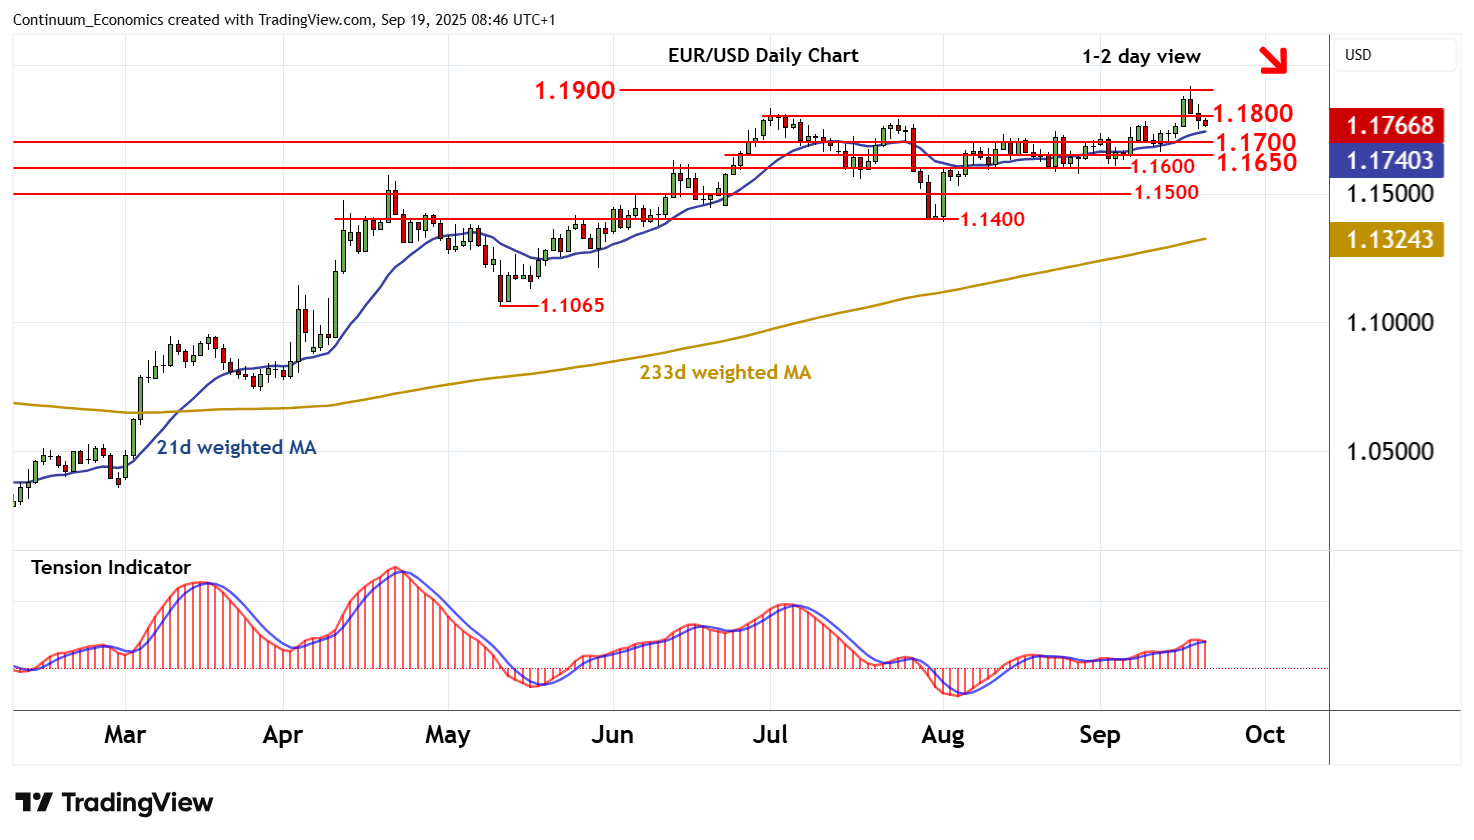
Chart EUR/USD Update: Extending pullback
Anticipated losses have reached 1.1750
| Levels | Imp | Comment | Levels | Imp | Comment | |||
|---|---|---|---|---|---|---|---|---|
| R4 | 1.2000 | ** | historic congestion | S1 | 1.1700 | * | congestion | |
| R3 | 1.1918 | ** | 17 Sep YTD high | S2 | 1.1650 | * | congestion | |
| R2 | 1.1900 | ** | historic congestion | S3 | 1.1600 | ** | congestion | |
| R1 | 1.1800 | * | congestion | S4 | 1.1500 | ** | congestion |
*Asterisk denotes strength of level
08:35 BST - Anticipated losses have reached 1.1750, where flat oversold intraday studies are prompting short-term reactions. Daily stochastics are falling, unwinding overbought areas, and the daily Tension Indicator is also coming under pressure, highlighting room for further losses in the coming sessions. Support is at congestion around 1.1700. But rising weekly charts are expected to limit any immediate break in renewed consolidation above further congestion around 1.1650. Meanwhile, resistance is at congestion around 1.1800. A close above here would help to stabilise price action and prompt consolidation beneath critical resistance at congestion around 1.1900 and the 1.1918 current year high of 17 September.