Published: 2025-07-11T05:55:42.000Z
Chart USD/TWD Update: Extending gains from 58.800 low

Technical Analyst
-
Extending bounce from the 58.800 low and 76.4% Fibonacci level as prices unwind oversold daily studies
| Levels | Imp | Comment | Levels | Imp | Comment | |||
|---|---|---|---|---|---|---|---|---|
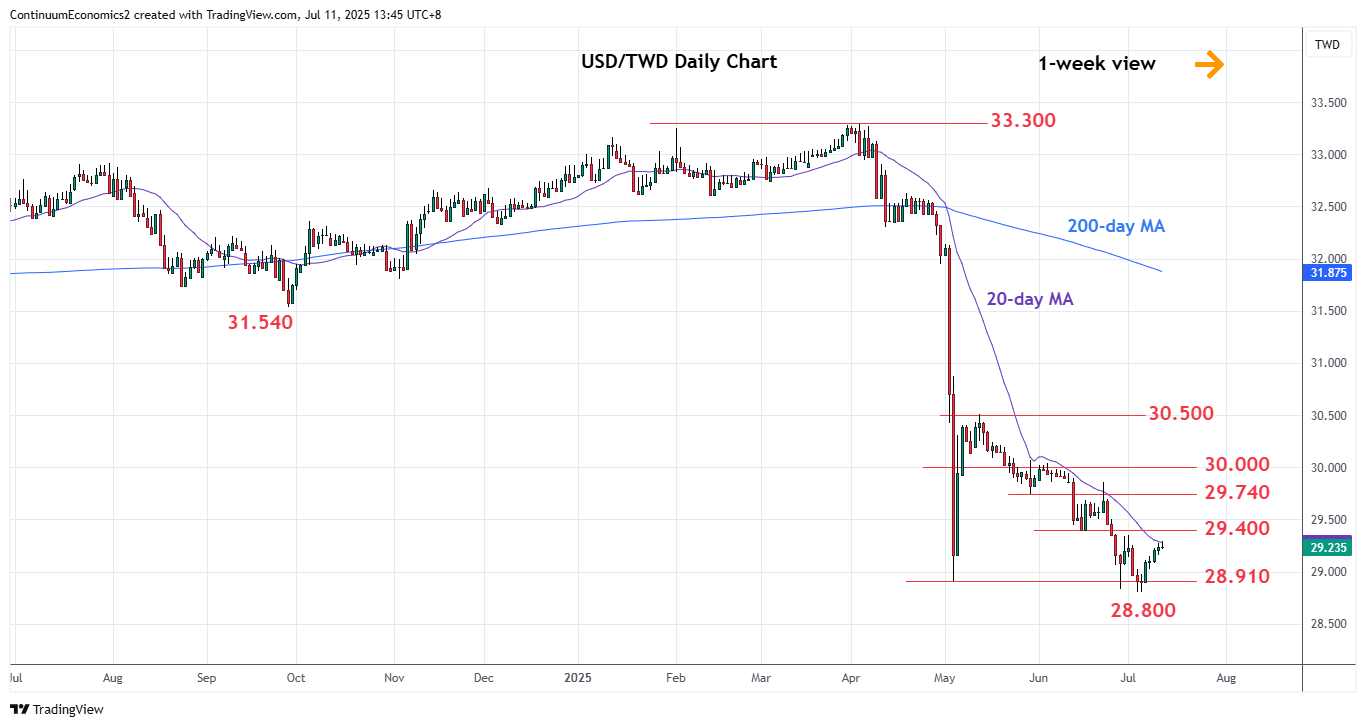
| R4 | 30.500 | ** | 13 May high | S1 | 29.000 | * | congestion | |
| R3 | 30.000 | ** | congestion | S2 | 28.910 | * | May low | |
| R2 | 29.740 | * | 29 May low | S3 | 28.800 | * | 4 Jul YTD low, 76.4% | |
| R1 | 29.400 | * | 16 Jun low | S4 | 28.500 | * | congestion |
05:50 GMT - Extending bounce from the 58.800 low and 76.4% Fibonacci level as prices unwind oversold daily studies. Weekly chart are stretched as well and see room for stronger bounce to retrace losses from the 30.500, 13 May corrective high. Nearby see resistance at the 29.400, 16 June low. Clearance here will open up room for stronger correction to the 29.740/29.300 resistance. Correction is expected to give way to fresh selling pressure later, break of the 29.000 congestion and 28.910/28.800 lows will further retrace the 2021/2025 rally.