Published: 2026-02-06T01:28:57.000Z
Chart GBP/USD Update: Extending January losses
2
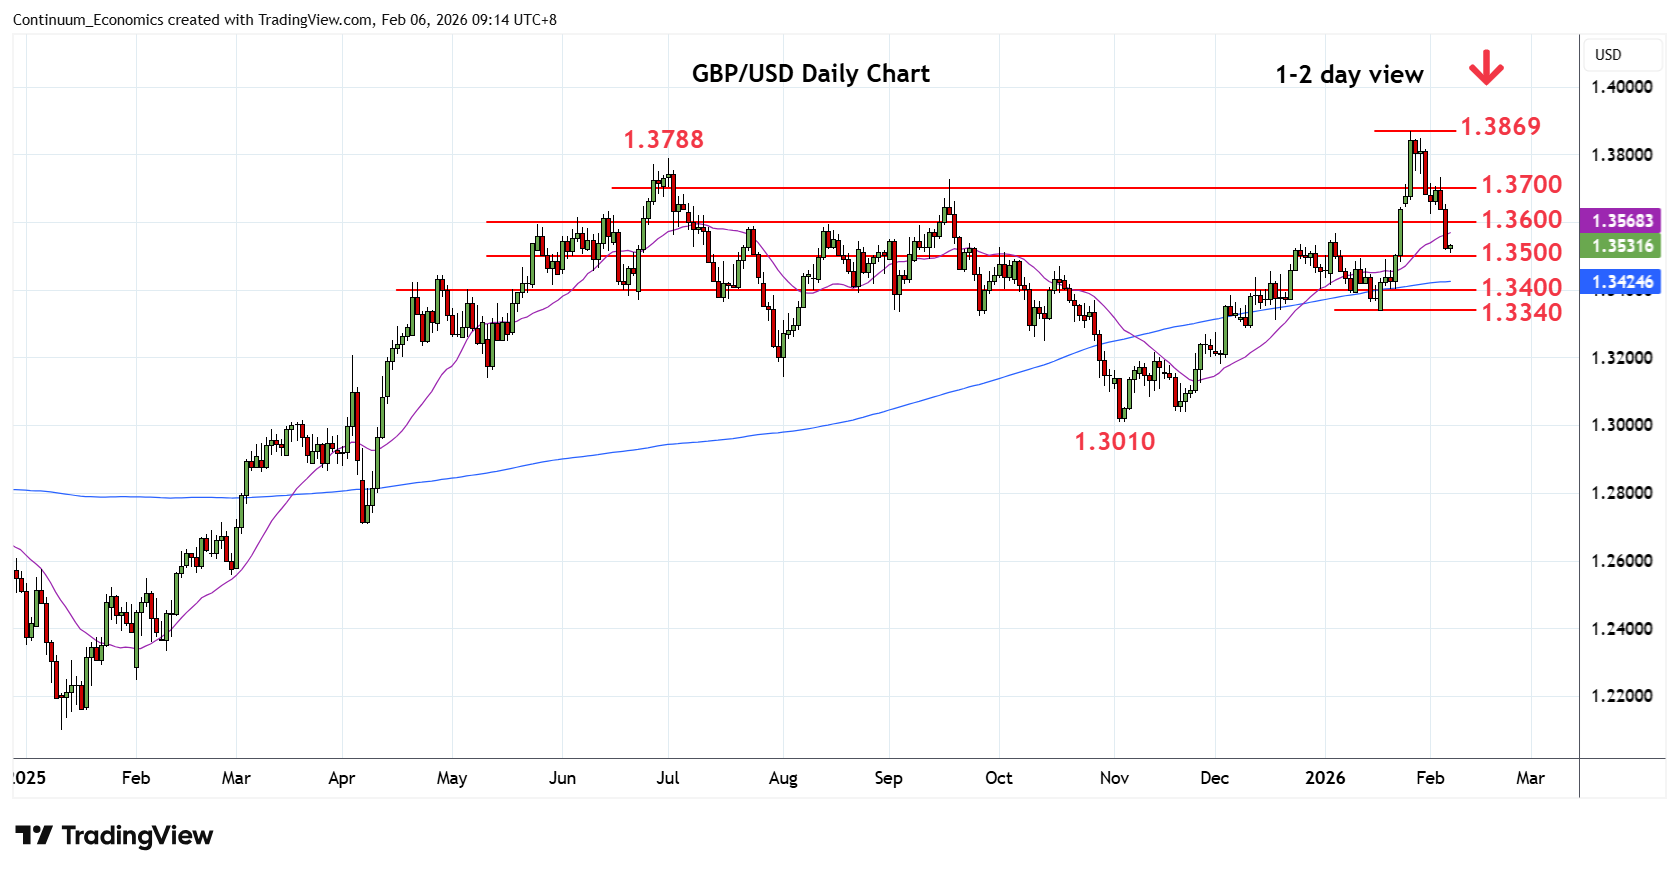
Consolidation above the 1.3623 low has given way to break of the 1.3600/1.3568 support to approach the 1.3500 level
| Level | Comment | Level | Comment | |||||
|---|---|---|---|---|---|---|---|---|
| R4 | 1.3788 | * | Jul high | S1 | 1.3500 | * | congestion | |
| R3 | 1.3700 | * | congestion | S2 | 1.3440 | * | 50%Nov/Jan rally | |
| R2 | 1.3600/20 | ** | congestion | S3 | 1.3400 | * | congestion | |
| R1 | 1.3568 | * | 6 Jan high | S4 | 1.3340 | ** | 19 Jan YTD low, 61.8% |
Asterisk denotes strength of level
01:20 GMT - Consolidation above the 1.3623 low has given way to break of the 1.3600/1.3568 support to approach the 1.3500 level. Daily studies are tracking lower and threatens break here to open up room for deeper pullback to 1.3440, 50% Fibonacci level and the 1.3400 congestion. However, corrective pullback is expected to give way to renewed buying interest later with resistance starting at the 1.3568 and extending to the 1.3600/20 area. Would need to regain these to fade the downside pressure and return focus to the upside.