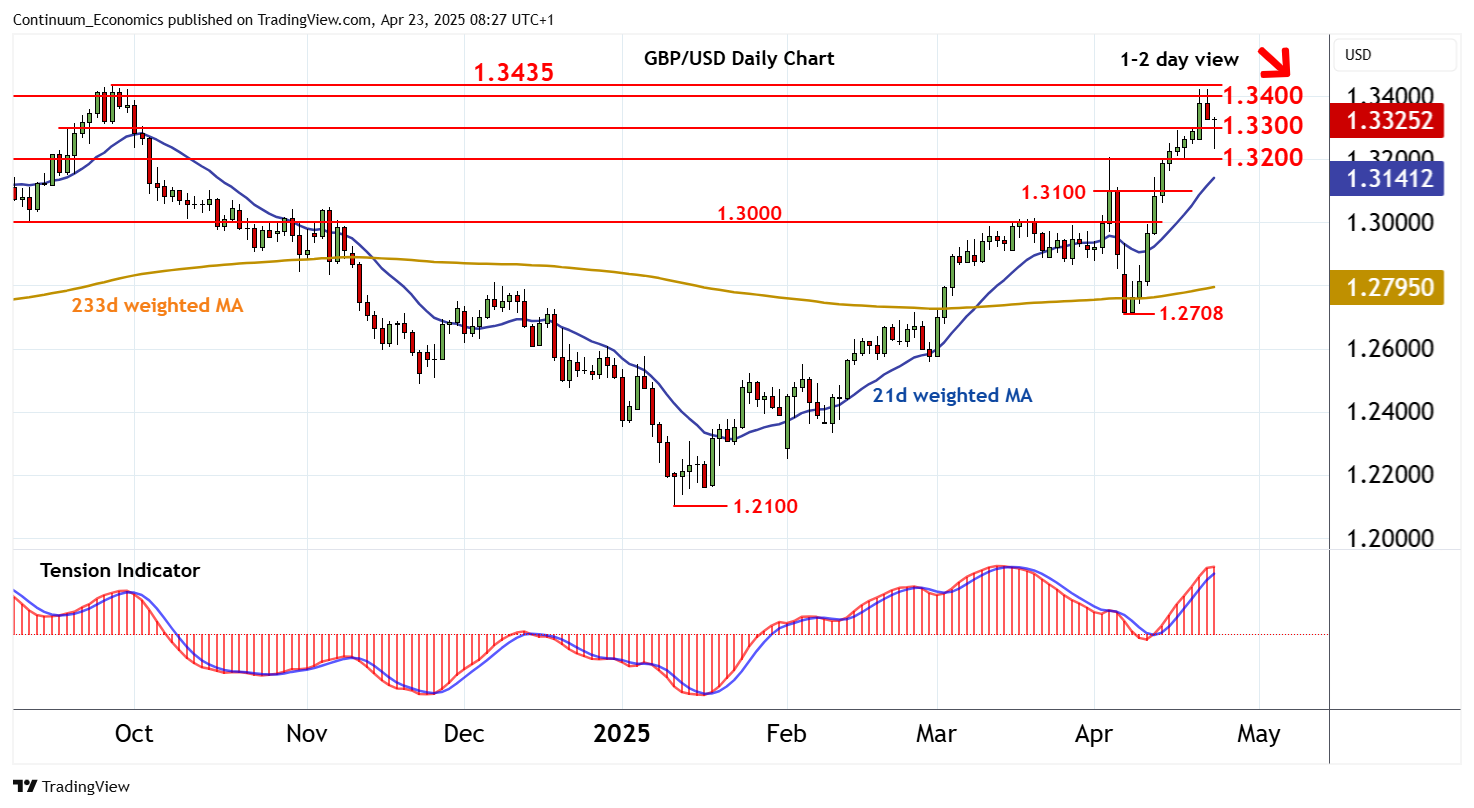
Chart GBP/USD Update: Choppy at year highs - studies under pressure

Cautious trade has given way to a spike lower
| Level | Comment | Level | Comment | |||||
|---|---|---|---|---|---|---|---|---|
| R4 | 1.3640/50~ | * | Feb 2022 high; congestion | S1 | 1.3300 | range highs | ||
| R3 | 1.3600 | ** | congestion | S2 | 1.3200 | ** | break level | |
| R2 | 1.3500 | ** | congestion | S3 | 1.3100 | minor congestion | ||
| R1 | 1.3435 | ** | 26 Sep 2024 (y) high | S4 | 1.3000 | ** | range highs |
Asterisk denotes strength of level
08:10 BST - Cautious trade has given way to a spike lower, with prices breaking below 1.3300 before bouncing from 1.3235~ to trade back above 1.3300. Oversold intraday studies are flat, suggesting consolidation, before a tick lower in overbought daily stochastics and the flattening positive daily Tension Indicator prompt fresh losses. A later break back below 1.3300 will add weight to sentiment and open up support at 1.3200, where positive weekly charts are expected to prompt renewed buying interest. A close beneath here, if seen, will turn sentiment negative and extend losses towards 1.3100. Meanwhile, resistance is at 1.3400 and extends to the 1.3435 year high of 26 September 2024. A close above would turn sentiment positive and extend broad September 2022 gains initially towards congestion around 1.3500. Beyond here is 1.3600.