Published: 2026-03-05T01:57:44.000Z
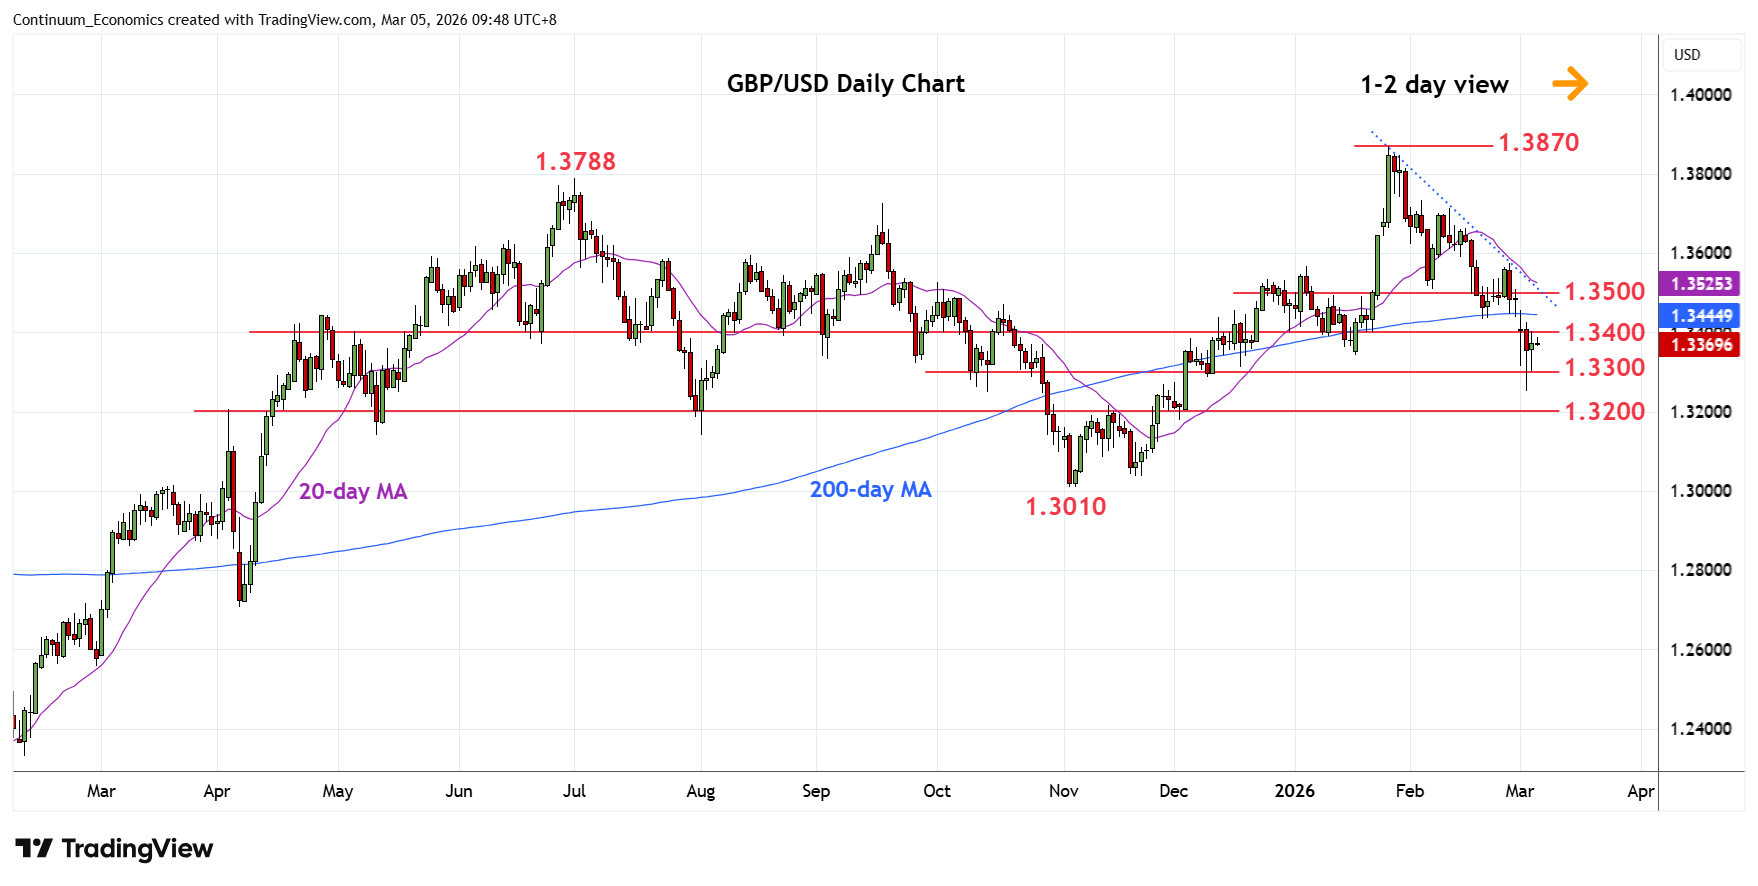
Chart GBP/USD Update: Consolidating losses to 1.3253 low
3
Turned up from the 1.3253 low to consolidate above the 1.3300 level as prices unwind oversold intraday studies
| Level | Comment | Level | Comment | |||||
|---|---|---|---|---|---|---|---|---|
| R4 | 1.3575 | ** | 26 Feb high | S1 | 1.3300 | * | congestion | |
| R3 | 1.3500/10 | ** | congestion, 6 Feb low | S2 | 1.3253 | ** | 3 Mar YTD low | |
| R2 | 1.3435 | * | 19 Feb low | S3 | 1.3215 | * | 76.4% Nov/Jan rally | |
| R1 | 1.3400 | * | congestion | S4 | 1.3200 | * | congestion |
Asterisk denotes strength of level
01:50 GMT - Turned up from the 1.3253 low to consolidate above the 1.3300 level as prices unwind oversold intraday studies. However, negative daily and weekly studies suggest consolidation giving way to fresh selling pressure later. Below the 1.3300 congestion and 1.3253 low will see room to 1.3215, 76.4% Fibonacci retracement, and the 1.3200 congestion. Meanwhile, resistance is lowered to the 1.3400/35 congestion and the 19 February low. This area now expected to cap and sustain losses from the 1.3870, January current year high.