Published: 2025-07-22T15:47:00.000Z
Chart USD/MXN Update: Room for lower in the coming sessions

Senior Technical Strategist
-
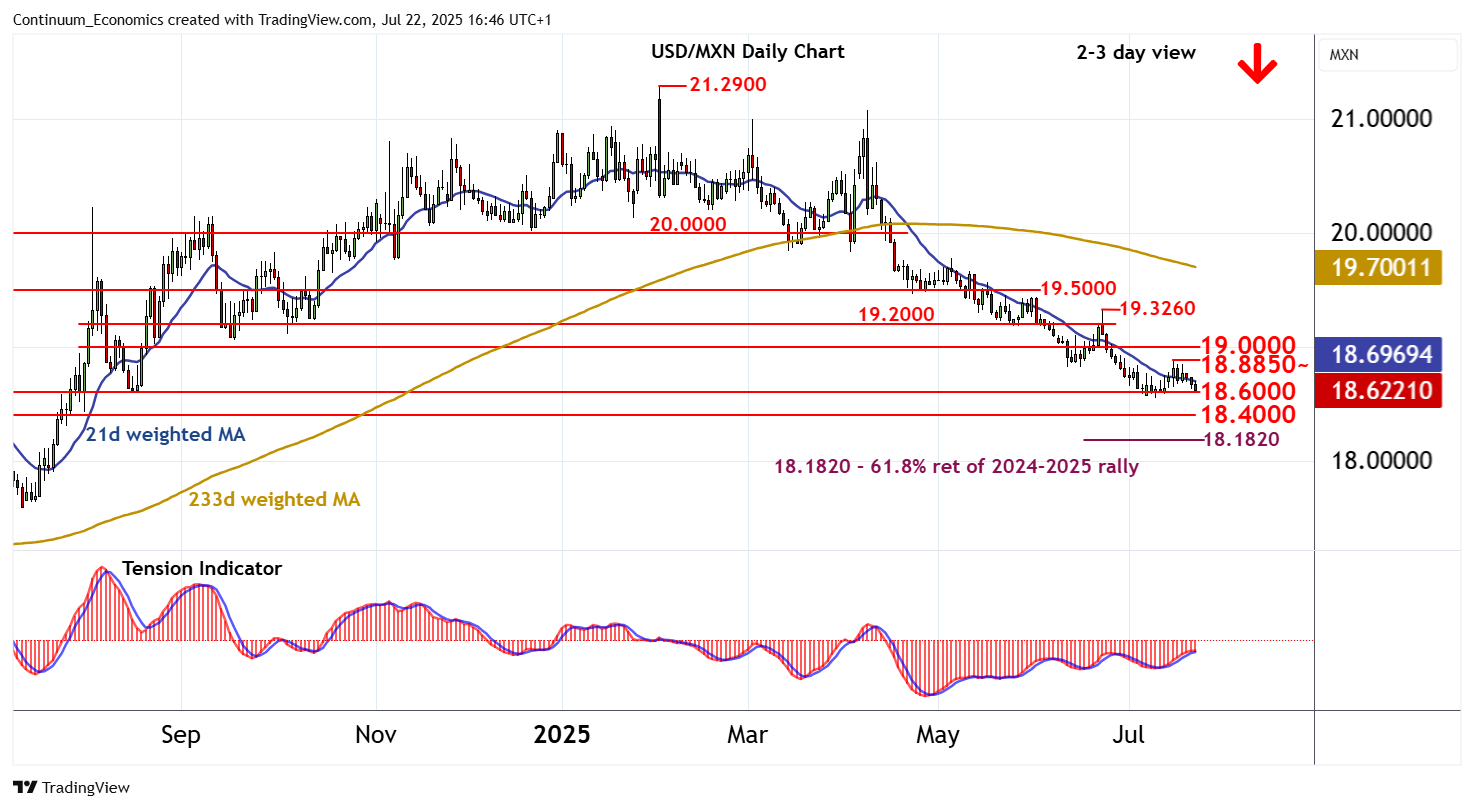
The pullback from the 18.8850 weekly high of 15 July is approaching strong support at 18.6000
| Levels | Imp | Comment | Levels | Imp | Comment | |||
|---|---|---|---|---|---|---|---|---|
| R4 | 19.3260 | ** | 23 Jun (w) high | S1 | 18.6000 | ** | July-August 2024 break level | |
| R3 | 19.2000 | * | congestion | S2 | 18.4265 | 1 Aug 2024 (m) low | ||
| R2 | 19.0000 | * | congestion | S3 | 18.4000 | ** | congestion | |
| R1 | 18.8850 | * | 15 Jul (w) high | S4 | 18.1820 | ** | 61.8% ret of 2024-2025 rally |
Asterisk denotes strength of level
16:35 BST - The pullback from the 18.8850 weekly high of 15 July is approaching strong support at 18.6000. Overbought daily stochastics are unwinding and the daily Tension Indicator is turning down, highlighting room for a break beneath here and continuation of February losses towards congestion support at 18.4000. Mixed weekly charts, however, are expected to limit any initial tests in consolidation, before bearish longer-term readings prompt a further break. Meanwhile, resistance is at congestion around 18.8000 and extends to 18.8850. This range should cap any immediate tests higher.