Continuum Economics
  • Search
  • About Us
  • Buy
  • Invite A Friend
  • My Basket
  • Articles
  • Calendar
  • Forecasts
  • Events
  • Data
  • Newsletters
  • My Alerts
  • Community
  • Directory
  • About Us
  • Buy
  • Invite A Friend
  • My Basket
  • Articles
    • All
    • Thematic
    • Tactical
    • Asia
    • EMEA
    • Americas
    • Newsletters
    • Freemium
    • Editor's Choice
    • Most Viewed
    • Most Shared
    • Most Liked
  • Calendar
    • Interactive
      • China
      • United States
      • Eurozone
      • United Kingdom
    • Month Ahead
    • Reviews
    • Previews
  • Forecasts
    • Forecasts
    • Key Views
  • Events
    • Media
    • Conference Calls
  • Data
    • Country Insights
    • Shadow Credit Ratings
    • Full CI Data Download
  • Newsletters
  • My Alerts
  • Community
    • FX
    • Fixed Income
    • Macro Strategy
    • Credit Markets
    • Equities
    • Commodities
    • Precious Metals
    • Renewables
  • Directory
  • My Account
  • Notifications Setup
  • Account Details
  • Recent Devices
  • Distribution Lists
  • Shared Free Trials
  • Saved Articles
  • Shared Alerts
  • My Posts
Published: 2025-04-16T03:05:48.000Z

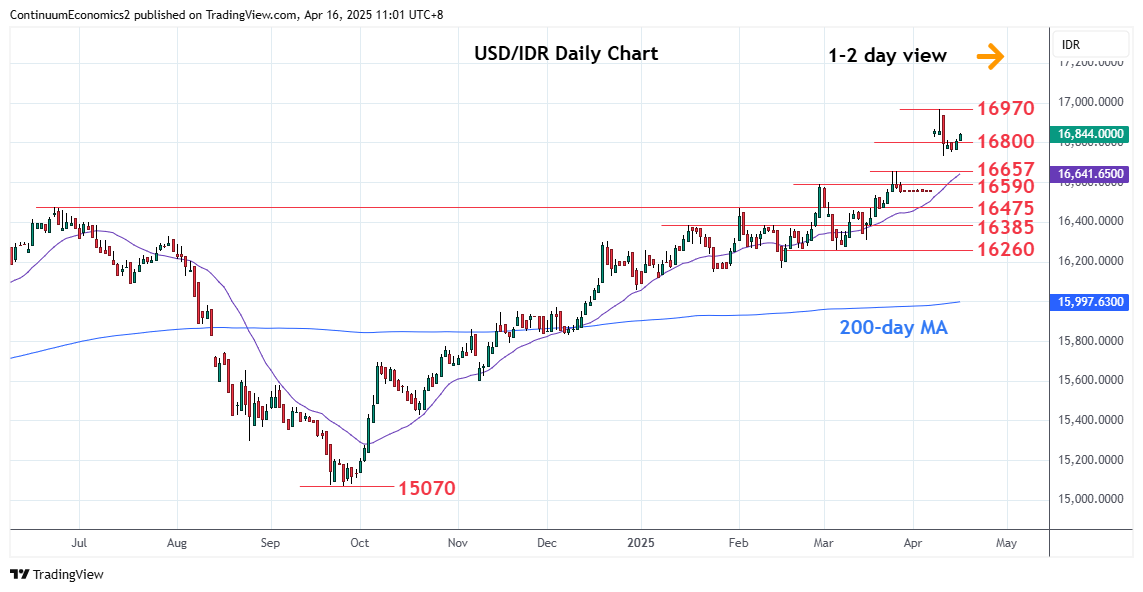
Chart USD/IDR Updates: Higher in range from 16729 low

byPakLai Ng

Technical Analyst
-

Edged up from the 16729 low but overbought daily studies suggest consolidation here to give way to selling pressure later

 LevelsImpComment  LevelsImpComment
R417115*projection S116729*10 Apr low             
R317050*projection S216657**Mar high
R217000**psychological S316590**Feb high
R116970**9 Apr all-time high S416535*19 Mar high

Asterisk denotes strength of level

03:10 GMT - Edged up from the 16729 low but overbought daily studies suggest consolidation here to give way to selling pressure later to extend losses from the 16970, all-time high. Daily studies have turned mixed from overbought areas and suggest scope for deeper pullback to strong support at the 16657/16590, March and February highs. Break here will see deeper correction of gains from the 15070 September low to the 16475, 2024 year high. Meanwhile, resistance at the 16970 high is expected to cap. Clearance, if seen, will extend the underlying bull trend to the 17000 psychological level.

Continue to read the article for free
Login

or

or

Topics
USD/IDR-TA
EM-Technical
Technical Analysis

GENERAL

  • Home
  • About Us
  • Our Team
  • Careers

LEGAL

  • Terms and Conditions
  • Privacy Policy
  • Compliance
  • GDPR

GET IN TOUCH

  • Contact Us
Continuum Economics
The Technical Analyst Awards Winner 2021
The Technical Analyst Awards Finalist 2020
image